Every organization depends on a reliable network to keep business operations functioning efficiently. Whether employees are collaborating through cloud applications, customers are completing transactions online, or internal systems are processing important data, network performance directly affects productivity and user satisfaction. When networks perform well, work happens smoothly and users rarely think about the infrastructure supporting their daily activities. However, when problems arise, delays, interruptions, and outages quickly become noticeable and can create serious operational challenges.
This is why network metrics are essential. Network metrics are measurable values that reveal how a network is performing at any given moment. They help IT professionals monitor system health, troubleshoot issues, optimize resources, and maintain consistent performance across connected environments.
Without metrics, network management becomes guesswork. If an application is running slowly, administrators need data to determine whether the issue is caused by congestion, hardware limitations, latency, packet loss, or poor routing paths. Network metrics provide the evidence needed to locate the source of problems and apply targeted solutions.
For IT professionals, understanding network metrics is one of the most valuable technical skills. These measurements make it possible to identify weaknesses before they become outages, improve efficiency, and ensure that digital systems remain reliable as organizational demands continue to grow.
What Are Network Metrics?
Network metrics are quantitative measurements that describe the condition and behavior of a network. They provide technical insight into how data moves across infrastructure, how efficiently devices communicate, and whether network resources are being used effectively.
These measurements can be collected from nearly every device connected to a network, including routers, switches, servers, wireless access points, firewalls, cloud platforms, and monitoring appliances.
The information collected helps administrators answer important questions such as whether the network is healthy, whether capacity is being exhausted, whether traffic is flowing efficiently, and whether users are likely to experience performance problems.
Network metrics act as the network’s vital signs. Just as doctors monitor pulse and blood pressure to assess human health, network engineers monitor performance indicators to evaluate infrastructure health.
When metrics remain within expected ranges, network performance is considered stable. When measurements move outside acceptable thresholds, they often indicate congestion, faults, or inefficiencies that require attention.
Why Network Metrics Matter
Modern networks are dynamic systems. Traffic levels constantly shift as users connect, applications exchange information, updates occur, and services scale to meet demand. Because these conditions are always changing, continuous measurement is necessary to maintain visibility.
Metrics matter because they allow organizations to detect issues early, optimize performance, plan future upgrades, and minimize downtime.
Without measurable data, troubleshooting often relies on assumptions. This wastes valuable time and increases operational risk.
For example, if users complain that cloud applications feel slow, there are many possible causes. The problem could involve insufficient bandwidth, excessive latency, unstable jitter, overloaded devices, DNS delays, or software misconfiguration.
Metrics eliminate guesswork by identifying exactly where performance is breaking down.
They also support proactive management. Instead of waiting for users to report failures, administrators can monitor trends and correct developing issues before service quality declines.
This proactive approach improves uptime, strengthens user confidence, and reduces costly disruptions.
Major Categories of Network Metrics
Network metrics generally fall into several broad categories, each revealing different aspects of performance and reliability.
Performance Metrics
Performance metrics measure speed and responsiveness.
These metrics show how quickly data moves across the network and how efficiently systems process communication.
Examples include bandwidth, latency, throughput, jitter, and response times.
Performance metrics are often the first indicators examined when users report slowness or delays.
If these measurements drift outside expected ranges, users may notice lag, buffering, slow application response, or interrupted communication.
Reliability Metrics
Reliability metrics reveal how consistently the network delivers stable service.
Examples include packet loss, error rates, connection failures, retransmissions, and device uptime.
A reliable network delivers predictable service with minimal interruptions.
If reliability measurements worsen, users may experience dropped calls, incomplete file transfers, unstable remote sessions, or disconnected services.
Utilization Metrics
Utilization metrics measure resource consumption across infrastructure components.
Examples include interface saturation, CPU usage, memory utilization, active session counts, and traffic volume.
These measurements help administrators identify overloaded devices and inefficient resource allocation.
Overutilized systems may struggle to process traffic efficiently, causing performance degradation.
Underutilized systems may indicate wasted investment or opportunities to consolidate resources.
Balanced utilization improves cost efficiency and performance stability.
Security Metrics
Security metrics monitor unusual or potentially harmful network activity.
Examples include intrusion attempts, failed login rates, blocked traffic events, suspicious traffic spikes, and response times to detected incidents.
Monitoring security metrics helps identify attacks quickly and supports rapid response efforts.
These measurements are critical for maintaining network integrity and reducing exposure to cyber threats.
Scalability Metrics
Scalability metrics evaluate whether infrastructure can support growth.
Examples include traffic growth trends, connection volume increases, device load expansion, and projected capacity exhaustion.
Organizations use scalability metrics to plan upgrades before performance problems affect users.
Without scalability monitoring, infrastructure often reaches its limits unexpectedly.
The Importance of Baselines
A baseline is a record of normal network behavior under standard operating conditions.
Baselines are essential because they provide context for interpreting measurements.
Without historical reference points, it is difficult to determine whether current performance is healthy or abnormal.
For example, a latency reading of 30 milliseconds may be perfectly acceptable for one environment but problematic for another.
If baseline latency is normally 10 milliseconds, then 30 milliseconds represents a significant degradation.
Baselines help engineers recognize unusual behavior quickly and respond appropriately.
Effective baselines typically include average bandwidth consumption, normal latency ranges, expected packet loss percentages, common peak usage periods, and regular utilization patterns.
The longer metrics are collected, the more accurate baselines become.
Long-term observation reveals patterns that short-term monitoring cannot detect.
How Metrics Are Collected
Network metrics are gathered using monitoring tools and standardized protocols.
These systems collect data directly from network devices and present it through dashboards, alerts, reports, and analytics engines.
One of the most common collection methods is Simple Network Management Protocol.
SNMP allows devices to share operational data using standardized object identifiers.
Because most enterprise hardware supports SNMP, it enables centralized monitoring across diverse environments.
Other collection methods include flow monitoring protocols, packet inspection systems, cloud analytics platforms, and built-in operating system monitoring tools.
Advanced monitoring platforms combine multiple data sources to provide detailed visibility into network behavior.
These tools allow engineers to monitor live conditions while preserving historical records for analysis.
Continuous data collection enables faster troubleshooting and more accurate performance forecasting.
Bandwidth as a Foundational Metric
Bandwidth is one of the most widely recognized network metrics.
It represents the maximum amount of data that can be transmitted across a connection within a given period.
Bandwidth is measured in bits per second and commonly expressed as megabits or gigabits per second.
Higher bandwidth allows more simultaneous traffic to move through the network.
Bandwidth is often compared to highway lanes. More lanes allow more vehicles to travel at once.
However, bandwidth alone does not guarantee fast performance.
A high-capacity connection can still perform poorly if latency is high, packet loss is excessive, or congestion is unmanaged.
Monitoring bandwidth helps ensure sufficient capacity exists for applications such as video conferencing, file sharing, cloud access, and streaming services.
Insufficient bandwidth creates bottlenecks that slow all dependent services.
Throughput and Real-World Performance
Throughput is closely related to bandwidth but measures actual delivered performance.
Bandwidth reflects theoretical maximum capacity.
Throughput reflects how much usable data is successfully transmitted in practice.
Throughput is often lower than available bandwidth due to overhead, congestion, retransmissions, and processing delays.
Monitoring throughput reveals the network’s real-world effectiveness.
If bandwidth appears sufficient but throughput is poor, deeper investigation is needed.
Possible causes include packet loss, routing inefficiencies, overloaded devices, or protocol limitations.
Understanding throughput helps administrators focus on practical performance rather than theoretical capacity.
Using Metrics for Better Decision Making
Network metrics support evidence-based decision making.
Rather than relying on assumptions or user complaints alone, administrators can analyze objective measurements.
This improves troubleshooting accuracy and infrastructure planning.
Metrics guide decisions such as whether to upgrade bandwidth, replace hardware, redesign routing paths, adjust quality of service policies, or expand capacity.
They also help justify technical investments by providing measurable proof of performance limitations.
Executives are more likely to approve upgrades when presented with clear performance data.
Metrics bridge the gap between technical teams and business leadership.
Long-Term Value of Continuous Monitoring
Network monitoring is not a one-time task.
Continuous observation reveals patterns that help organizations improve over time.
Long-term metrics expose recurring congestion periods, gradual hardware degradation, growth trends, and hidden inefficiencies.
This visibility supports smarter infrastructure planning and stronger operational resilience.
Organizations that monitor continuously benefit from faster troubleshooting, fewer outages, better resource allocation, and improved user satisfaction.
As digital environments grow more complex, continuous measurement becomes even more important.
Reliable visibility is the foundation of effective network management.
The Core Measurements of Network Performance
Network performance depends on several measurable factors, but few are as critical as bandwidth and latency. These two metrics influence how quickly information moves across infrastructure and how responsive systems feel to users. When people experience slow downloads, delayed application responses, buffering video calls, or sluggish cloud platforms, bandwidth and latency are often the underlying causes.
Although these two terms are frequently mentioned together, they represent very different aspects of network behavior. Understanding the distinction between them is essential for diagnosing performance issues accurately.
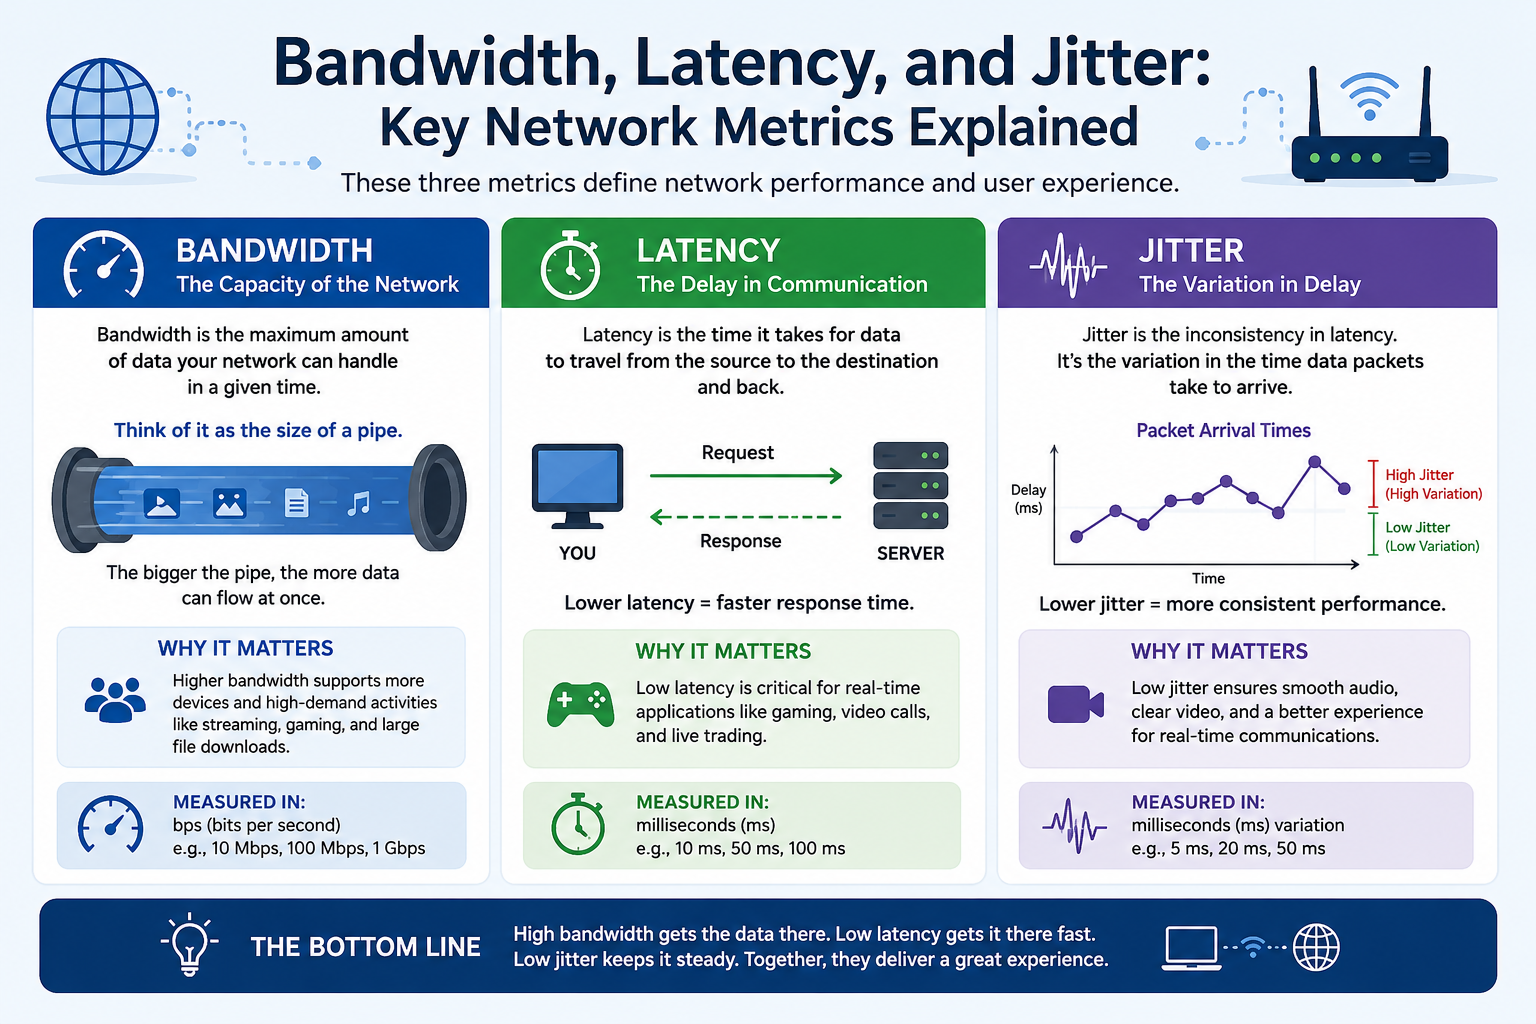
Bandwidth measures how much data a network can carry over a given period, while latency measures how long data takes to travel from one point to another. A network can have high bandwidth but still feel slow if latency is excessive. Likewise, a network can have low latency but still struggle if available bandwidth is insufficient for current demand.
For IT professionals, learning how to evaluate and optimize these metrics is critical for maintaining efficient, responsive, and reliable systems. By understanding what affects bandwidth and latency, administrators can improve application performance, reduce user frustration, and build stronger network infrastructure.
Understanding Bandwidth
Bandwidth refers to the maximum amount of data that can be transmitted across a network connection within a specific amount of time.
It is typically measured in bits per second and commonly expressed in units such as megabits per second or gigabits per second.
Bandwidth represents network capacity rather than actual delivered speed.
A useful comparison is a highway. A wider highway with more lanes allows more vehicles to travel simultaneously. Similarly, a network connection with greater bandwidth allows more data to move at the same time.
This capacity determines how much simultaneous activity a network can support.
High-bandwidth environments are necessary for handling workloads such as:
Cloud computing platforms
Large-scale file transfers
High-definition video conferencing
Media streaming
Database synchronization
Virtual desktop infrastructure
Enterprise application traffic
As organizations rely more heavily on digital systems, bandwidth requirements continue to grow.
Insufficient bandwidth leads to congestion, delayed transfers, buffering, and reduced productivity.
Bandwidth Does Not Equal Speed
A common misconception is that bandwidth directly determines network speed.
Bandwidth measures capacity, not responsiveness.
A connection may support enormous bandwidth while still feeling slow due to high latency, packet loss, poor routing, or overloaded devices.
For example, downloading a large file may complete quickly because sufficient bandwidth is available.
At the same time, interacting with a remote cloud application may feel sluggish because latency is high.
This distinction is essential when troubleshooting performance complaints.
Increasing bandwidth will not fix every problem.
Sometimes responsiveness issues stem from latency rather than capacity limitations.
Understanding this difference helps engineers apply the correct solution.
How Bandwidth Is Measured
Bandwidth can be measured using several approaches.
Internet speed tests are commonly used to verify upload and download rates provided by service providers.
These tools provide quick performance snapshots but limited internal visibility.
Professional network monitoring platforms offer more detailed measurement by tracking interface utilization in real time.
These systems reveal:
Traffic peaks
Usage trends
Application consumption
Protocol-specific activity
Capacity saturation points
Historical growth patterns
Monitoring bandwidth continuously allows administrators to identify recurring congestion and plan upgrades proactively.
Another common measurement method uses SNMP.
Simple Network Management Protocol allows devices to report traffic statistics through standardized object identifiers.
This enables centralized monitoring across multi-vendor environments.
Flow monitoring technologies also provide valuable bandwidth visibility by showing which applications, users, and destinations consume network resources.
This detailed insight helps engineers optimize traffic distribution.
Factors That Affect Bandwidth Usage
Bandwidth consumption depends on many variables.
The number of connected users significantly affects demand.
As more devices exchange data simultaneously, total usage rises.
Application behavior also influences consumption.
Streaming video, large downloads, cloud backups, and software updates can quickly saturate links.
Improperly configured applications may generate unnecessary traffic.
Malware infections sometimes create abnormal bandwidth spikes as malicious software communicates externally.
Infrastructure limitations also affect effective capacity.
Old switches, limited router processing power, or poor cabling may reduce usable bandwidth.
Even if service provider capacity is high, internal bottlenecks can restrict performance.
Understanding these variables helps engineers identify where optimization efforts should focus.
Optimizing Bandwidth Utilization
Efficient bandwidth management improves performance without requiring expensive upgrades.
One common strategy is quality of service configuration.
Quality of service prioritizes critical traffic over less important activity.
For example, voice and video traffic can receive priority over software updates or large downloads.
This ensures sensitive applications remain responsive during congestion.
Traffic shaping is another effective method.
Traffic shaping controls transmission rates for selected applications.
Nonessential traffic can be slowed slightly to preserve capacity for critical services.
Application control also improves efficiency.
Administrators can limit or restrict bandwidth-heavy services that do not support business operations.
Examples include personal streaming services and unnecessary background synchronization.
Regular auditing identifies wasteful traffic patterns and inefficient configurations.
Optimization often reveals performance gains without increasing overall capacity.
Understanding Latency
Latency measures the time required for data to travel from its source to its destination.
It is usually measured in milliseconds.
Latency reflects responsiveness rather than capacity.
Low latency means information travels quickly, producing smooth interactions.
High latency introduces noticeable delays between actions and responses.
Latency directly affects user experience in applications requiring immediate feedback.
Examples include:
Remote desktop sessions
Online gaming
Financial transactions
Cloud-based productivity tools
Video conferencing
Voice communication systems
Interactive databases
Even small increases in latency can degrade responsiveness significantly.
A few extra milliseconds may be unnoticeable during file downloads but highly disruptive during live conversations.
Round Trip Time
Round trip time is one of the most common latency measurements.
It represents the total time required for a packet to travel to its destination and return with acknowledgment.
Round trip time includes:
Propagation delay
Transmission delay
Queuing delay
Processing delay
These components combine to determine total responsiveness.
Monitoring round trip time helps engineers identify latency increases quickly.
Sudden spikes often indicate congestion or routing issues.
Round trip time is commonly measured using tools such as ping.
Repeated measurements reveal consistency and expose instability.
Sources of Latency
Several factors contribute to network latency.
Physical distance is one of the most unavoidable causes.
Signals require time to travel, even at near-light speeds.
Long-distance connections naturally introduce delay.
Communication between continents always involves measurable latency.
Network congestion also increases delay.
When links become saturated, packets wait in queues before transmission.
Heavy traffic causes delays to accumulate rapidly.
Device processing limitations can introduce latency as routers and firewalls inspect and forward packets.
Older or overloaded devices often process traffic more slowly.
Poor routing decisions create unnecessary network hops.
Each additional hop introduces extra delay.
Transmission medium also matters.
Fiber connections generally provide lower latency than satellite links because signals travel more directly and with less overhead.
Misconfigurations can worsen latency through inefficient path selection or excessive inspection policies.
Identifying these sources allows targeted optimization.
Measuring Latency
Ping is the simplest latency measurement tool.
It sends test packets and reports round trip time.
Repeated ping tests help establish normal response times and reveal spikes.
Traceroute provides deeper insight by showing latency at each network hop.
This helps engineers identify where delays occur along the path.
Advanced monitoring software tracks latency continuously and generates alerts when thresholds are exceeded.
Historical latency graphs reveal patterns linked to congestion periods or infrastructure events.
Cloud monitoring platforms often include synthetic transaction testing, which measures application response latency from multiple locations.
These measurements help organizations evaluate user experience globally.
Why Low Latency Matters
Low latency is essential for modern digital environments.
Users expect immediate responses from applications.
Delays create frustration and reduce productivity.
Real-time communication systems depend especially heavily on low latency.
Voice calls become awkward when delays interrupt conversation flow.
Video meetings feel unnatural when participants speak over one another due to delayed audio.
Cloud applications require low latency for smooth interaction.
Even slight delays make systems feel sluggish.
Financial systems rely on low latency for rapid transaction execution.
Milliseconds can have significant operational impact.
Industrial automation systems often require extremely low latency for safe and precise control.
As organizations adopt more interactive digital services, latency optimization becomes increasingly important.
Reducing Latency
Several strategies help minimize latency.
Optimizing routing paths reduces unnecessary hops.
Efficient routing ensures packets travel directly.
Content delivery networks reduce latency by placing resources closer to users.
This minimizes geographic distance.
Caching frequently accessed data reduces repeated retrieval delays.
Locally stored content responds faster.
Upgrading outdated hardware improves packet processing speed.
Modern devices handle traffic more efficiently.
Increasing bandwidth can reduce congestion-related latency by preventing queue buildup.
However, bandwidth upgrades alone do not address all latency causes.
Traffic prioritization ensures critical packets bypass delays caused by lower-priority activity.
Monitoring continuously helps engineers detect rising latency before users notice problems.
Bandwidth and Latency Together
Bandwidth and latency interact but measure different behaviors.
Bandwidth controls how much data can move simultaneously.
Latency controls how quickly communication begins and completes.
An ideal network provides both high bandwidth and low latency.
Large file transfers benefit from bandwidth.
Interactive applications depend on low latency.
A network with low bandwidth but excellent latency may feel responsive for simple tasks but struggle with large transfers.
A network with high bandwidth but poor latency may handle bulk transfers well while feeling sluggish during live interaction.
Understanding both metrics together allows more accurate troubleshooting and better infrastructure planning.
Planning for Future Growth
Bandwidth and latency requirements increase as organizations expand.
Cloud adoption, remote work, video collaboration, and connected devices all raise performance expectations.
Monitoring trends allows administrators to anticipate future needs.
Historical growth patterns reveal when upgrades will become necessary.
Capacity planning prevents performance degradation before users experience problems.
Proactive investment supports long-term stability.
Jitter, Monitoring Strategies, and Building Reliable Network Performance
Introduction
While bandwidth and latency are often the most discussed network performance metrics, another equally important measurement can significantly affect user experience and overall network stability. This metric is jitter.
Jitter measures inconsistency in packet delivery timing. Unlike latency, which measures how long it takes for data to travel across a network, jitter measures the variation in delay between packets arriving at their destination.
Even if average latency appears low, unstable delivery timing can cause major performance problems for applications that depend on smooth, real-time communication. Voice calls may sound robotic, video streams may freeze, and cloud applications may become unpredictable.
Jitter is especially important in modern network environments where businesses increasingly depend on voice over IP systems, cloud collaboration tools, video conferencing platforms, streaming services, and remote work infrastructure.
Understanding jitter, learning how to measure it, and implementing strategies to control it are essential steps toward building reliable network performance.
This section explores jitter in depth while also examining broader monitoring strategies, proactive maintenance approaches, automation techniques, and best practices that help organizations maintain stable and efficient network infrastructure.
What Is Jitter?
Jitter is the variation in packet arrival times across a network connection.
When data is transmitted over a network, it is divided into packets that travel independently to their destination.
Ideally, packets arrive at regular intervals and in the correct sequence.
When delivery timing becomes inconsistent, jitter occurs.
For example, if packets are expected to arrive every twenty milliseconds but some arrive in ten milliseconds while others arrive in forty milliseconds, the timing variation creates jitter.
This inconsistency disrupts applications that depend on predictable timing.
Unlike file transfers, which can tolerate slight delays by retransmitting missing data, real-time communication systems cannot wait for delayed packets.
This makes jitter especially damaging for live services.
Why Jitter Matters
Jitter affects user experience directly.
When packet delivery timing becomes unstable, communication quality suffers.
Voice calls may become distorted or delayed.
Video conferencing sessions may freeze or lose synchronization.
Streaming media may buffer unexpectedly.
Remote desktop sessions may feel unstable and inconsistent.
Industrial control systems relying on real-time communication may experience command execution delays.
High jitter often creates the impression that systems are unreliable even when bandwidth appears sufficient.
Users typically notice jitter as:
Audio skipping or distortion
Video freezing or stuttering
Delayed response during remote access
Inconsistent application responsiveness
Random interruptions in communication sessions
Because jitter can occur even when bandwidth and average latency appear healthy, it often surprises administrators who are not actively monitoring it.
This makes jitter measurement essential for comprehensive network visibility.
Common Causes of Jitter
Several factors contribute to jitter.
One of the most common causes is network congestion.
When network links become saturated, packets wait in transmission queues.
Variable queue lengths cause packets to experience different delays, creating timing inconsistency.
Routing instability also contributes to jitter.
If packets follow different network paths due to route changes or load balancing, travel times may vary.
Each route introduces unique delay characteristics.
Hardware limitations can create jitter when routers or switches struggle to process packets consistently.
Older equipment may introduce processing variation under heavy load.
Improper quality of service configuration often allows low-priority traffic to interfere with time-sensitive applications.
Large file transfers may delay voice or video packets if prioritization policies are absent.
Wireless interference can also produce jitter.
Signal disruption causes retransmissions and inconsistent delivery timing.
Environmental factors, device contention, and radio congestion often affect wireless performance.
Software misconfiguration sometimes contributes to jitter through inefficient packet handling or overloaded virtual network functions.
Identifying these causes is the first step toward reducing jitter effectively.
Measuring Jitter
Several tools help administrators measure jitter.
Voice monitoring systems commonly include built-in jitter reporting.
These tools track packet timing variation during live calls.
Examples include enterprise voice infrastructure monitoring solutions.
Packet analyzers such as Wireshark provide detailed visibility into packet timing behavior.
Engineers can inspect delivery intervals and identify inconsistency patterns.
Ping-based testing can approximate jitter by measuring response time variation across repeated tests.
If response times fluctuate significantly, jitter may be present.
Specialized monitoring platforms continuously measure jitter across network paths and generate alerts when thresholds are exceeded.
These systems provide historical trend analysis for proactive maintenance.
Many enterprise routers and switches also provide jitter reporting through built-in telemetry and diagnostic tools.
This allows centralized visibility across distributed environments.
Continuous measurement is critical because jitter often appears intermittently.
Short manual tests may miss important timing instability.
Long-term monitoring reveals recurring patterns linked to congestion periods, routing changes, or environmental factors.
The Relationship Between Jitter and Packet Loss
Jitter and packet loss are closely related.
Excessive jitter often causes packets to arrive too late for real-time applications to use them.
When delayed packets exceed acceptable timing windows, applications discard them.
This effectively creates packet loss from the application’s perspective.
Voice systems often use jitter buffers to smooth timing variation.
These buffers temporarily store packets and release them at steady intervals.
If jitter exceeds buffer capacity, packets are dropped.
This causes audible gaps and distortion.
Video systems may freeze or degrade image quality when jitter-induced packet loss occurs.
Monitoring jitter alongside packet loss provides clearer visibility into communication quality.
Together, these metrics reveal whether timing instability is affecting service delivery.
Strategies for Reducing Jitter
Several proven strategies help minimize jitter.
Quality of service configuration is one of the most effective approaches.
By prioritizing time-sensitive traffic, administrators ensure voice and video packets receive immediate transmission preference.
This reduces queue-related timing variation.
Traffic shaping also improves consistency.
Limiting lower-priority traffic prevents sudden congestion spikes that disrupt packet timing.
Bandwidth upgrades may reduce congestion-induced jitter when links are consistently saturated.
However, simply increasing capacity is not always sufficient if routing inefficiencies remain.
Optimizing routing paths reduces variability caused by unnecessary hops.
Stable, predictable routes improve delivery consistency.
Replacing outdated hardware improves packet processing stability.
Modern infrastructure handles traffic more efficiently under load.
Wireless optimization reduces radio interference and retransmission instability.
This includes proper channel selection, signal strength improvements, and device placement adjustments.
Continuous monitoring ensures jitter trends are detected early and corrected before users experience serious disruption.
The Role of Monitoring Systems
Monitoring systems are essential for managing network health.
Without continuous visibility, administrators often discover issues only after users report problems.
Effective monitoring provides real-time insight into:
Bandwidth utilization
Latency trends
Jitter behavior
Packet loss rates
Device resource consumption
Connection stability
Security anomalies
Application performance
This visibility enables proactive maintenance.
Modern monitoring platforms present metrics through dashboards and visualization tools.
Graphs reveal trends that might otherwise remain hidden.
Historical reporting supports long-term analysis and capacity planning.
Alerting systems notify engineers immediately when thresholds are exceeded.
Fast detection reduces downtime and accelerates resolution.
Monitoring systems transform raw measurements into actionable intelligence.
They allow organizations to respond strategically rather than reactively.
Proactive Maintenance Through Metrics
Proactive maintenance uses metrics to prevent problems before they affect users.
This approach improves reliability and reduces operational disruption.
Historical trend analysis reveals patterns such as:
Recurring bandwidth saturation
Gradually increasing latency
Hardware resource exhaustion
Periodic packet loss events
Seasonal traffic spikes
Aging device performance decline
By identifying these trends early, organizations can act before failures occur.
Examples of proactive actions include:
Upgrading capacity before saturation becomes critical
Replacing failing hardware before outages occur
Adjusting routing policies to improve efficiency
Optimizing quality of service rules
Expanding infrastructure to support growth
Proactive maintenance reduces emergency troubleshooting and strengthens service stability.
Automation in Network Monitoring
Automation has become an essential part of modern network operations. As digital environments grow more complex and the volume of performance data increases, manually monitoring every metric becomes unrealistic. Automated systems allow organizations to continuously analyze network performance, identify abnormalities, and respond to issues far faster than traditional manual observation methods.
Automated monitoring platforms continuously collect and process performance data from across the network. These systems evaluate bandwidth utilization, latency patterns, jitter fluctuations, packet loss events, device resource usage, connection stability, and traffic behavior in real time. By analyzing this information automatically, they can identify unusual activity almost immediately.
Machine learning has made automation even more powerful. Intelligent monitoring platforms can learn normal network behavior over time and detect patterns that indicate developing issues. These systems often recognize subtle performance changes before traditional threshold-based alerts are triggered. This allows organizations to address problems early, often before users notice any service disruption.
Automated alerting ensures engineers receive immediate notification when critical conditions occur. Alerts can be delivered through email, messaging platforms, mobile notifications, or integrated service desk systems. This rapid communication significantly reduces response times and allows technical teams to act before small issues escalate into widespread outages.
Automation also supports self-healing network operations through remediation scripts. These scripts automatically execute corrective actions when predefined conditions are detected. This reduces the need for manual intervention and speeds up recovery.
Common automated remediation actions include restarting failed services, adjusting routing paths to bypass congested links, clearing stalled network sessions, redistributing workloads across available infrastructure, and applying traffic shaping policies to stabilize performance during congestion events.
For example, if a monitoring system detects that a critical application path is experiencing excessive latency, an automated routing adjustment can redirect traffic through a healthier route. If a service becomes unresponsive, an automated restart script can restore operation within seconds.
These capabilities reduce operational burden on IT teams and improve after-hours response coverage. Engineers no longer need to manually monitor dashboards around the clock, as automation provides continuous oversight and immediate corrective action when necessary.
Organizations with large or distributed environments benefit especially from automated monitoring intelligence. Managing thousands of devices, connections, and services manually is nearly impossible. Automation provides scalability, consistency, and faster issue resolution across complex infrastructures.
As networks continue evolving, automation will remain a critical tool for improving reliability, reducing downtime, and enabling more efficient network management. It transforms monitoring from a reactive process into a proactive system capable of maintaining strong performance with greater speed and precision.
Building Effective Performance Baselines
Reliable network monitoring depends on establishing accurate performance baselines. A baseline represents the normal operating behavior of a network under standard conditions and serves as a reference point for identifying unusual activity or performance degradation. Without a well-defined baseline, it becomes much harder to determine whether current network behavior is healthy or if an underlying issue is developing.
Baseline measurements typically include average latency ranges, expected jitter levels, normal bandwidth consumption, packet loss percentages, CPU and memory utilization across network devices, peak traffic periods, and connection growth patterns. These measurements provide a clear picture of how the network behaves during typical operation.
Latency baselines help administrators recognize when response times begin increasing beyond acceptable limits. Jitter baselines reveal whether packet delivery timing remains stable enough for real-time communication systems. Bandwidth baselines show normal traffic consumption and make it easier to identify saturation or unexpected spikes in usage. Packet loss baselines help detect failing hardware, unstable links, or congestion-related delivery issues.
Device performance metrics such as processor utilization and memory consumption also form a critical part of baseline monitoring. If resource usage suddenly rises above historical norms, this may indicate software problems, hardware strain, traffic anomalies, or security concerns requiring immediate investigation.
Traffic pattern baselines provide insight into predictable demand cycles. Many organizations experience recurring peak usage during specific business hours, reporting periods, or seasonal events. Understanding these patterns helps administrators distinguish expected high utilization from abnormal activity.
Connection growth trends are equally valuable. Monitoring increases in connected users, devices, or application demand allows organizations to plan upgrades before infrastructure limitations affect performance.
Baselines are not static measurements. Networks evolve constantly as new devices are added, applications change, users increase, and workloads shift. Because of this, baseline values must be reviewed and updated regularly to reflect current operational realities.
Comparing live performance data against baseline values allows faster anomaly detection and more accurate troubleshooting. Instead of relying solely on raw metrics, engineers can evaluate current measurements within the context of established normal behavior.
This context is what makes baselines so powerful. Raw numbers alone often provide limited insight, but when measured against historical norms, they reveal trends, abnormalities, and early warning signs that support proactive maintenance and stronger network reliability.
Collaboration Across Teams
Effective metric management requires collaboration.
Network engineers, system administrators, security analysts, and application teams often share responsibility for performance.
Cross-team communication improves troubleshooting efficiency.
For example, application slowdowns may stem from server resource exhaustion rather than network congestion.
Shared visibility helps teams isolate root causes quickly.
Collaborative analysis improves infrastructure planning and operational resilience.
Organizations with integrated technical teams generally resolve performance issues faster.
Continuous Improvement Practices
Network optimization is not a one-time effort.
Continuous improvement ensures long-term efficiency.
Best practices include:
Regular metric audits
Threshold refinement
Monitoring tool updates
Infrastructure performance reviews
Documentation updates
Staff training
Feedback analysis
Process refinement
The more familiar teams become with metric behavior, the faster they recognize irregularities.
Experience strengthens pattern recognition and operational decision-making.
Continuous learning improves reliability over time.
Conclusion
Jitter, monitoring strategies, and proactive maintenance are essential components of effective network management.
While bandwidth and latency often receive the most attention, jitter provides equally valuable insight into communication stability and user experience.
By measuring jitter accurately, identifying its causes, and applying targeted optimization strategies, organizations can significantly improve service consistency.
Comprehensive monitoring systems provide the visibility needed to maintain strong performance across evolving infrastructure environments.
Automation strengthens response speed and operational efficiency.
Proactive maintenance reduces downtime and supports long-term reliability.
As networks continue to grow in complexity, mastering these metrics becomes increasingly important.
Organizations that prioritize measurement, analysis, and continuous improvement build stronger, faster, and more resilient digital infrastructure capable of supporting modern business demands with confidence and stability.