Modern computers and servers handle thousands of processes every second. Applications constantly read and write data, network adapters transmit information across networks, and processors execute millions of instructions in very short periods of time. While all of this activity happens behind the scenes, it directly affects how smoothly a system performs. When systems become slow, unstable, or unresponsive, administrators need accurate information to determine what is happening internally. This is where Windows Performance Counters become extremely valuable.
Performance monitoring has become one of the most important responsibilities in information technology. Whether an administrator manages a single workstation or a large enterprise infrastructure, understanding how systems consume resources is essential for maintaining reliability and performance. Performance counters help administrators measure the behavior of hardware and software components in real time, allowing them to identify issues before they become serious problems.
Windows includes a built-in performance monitoring framework that tracks resource usage throughout the operating system. These metrics are known as performance counters because they count or measure specific system activities. They provide detailed information about processor utilization, memory usage, disk operations, networking activity, and application performance. Administrators can use this information to troubleshoot problems, optimize systems, and make informed decisions about hardware and software deployment.
Performance counters are especially useful because they provide objective data instead of relying on assumptions. Users often report that a system feels slow or unstable, but those descriptions are subjective. Two users may experience the same issue differently depending on the applications they use and their expectations. Performance counters remove the guesswork by showing exactly how system resources are being used at a given moment.
For example, if a user complains that their laptop freezes whenever multiple applications are open, performance counters may reveal that memory usage is consistently reaching maximum capacity. In another case, a server running a database application may experience slow response times because the storage subsystem cannot keep up with disk requests. By examining performance metrics, administrators can pinpoint the exact cause of the issue rather than replacing hardware unnecessarily.
Performance monitoring is also important for proactive maintenance. Instead of waiting for systems to fail, administrators can continuously monitor metrics and detect warning signs early. Rising CPU usage, increasing memory pressure, or excessive disk queue lengths may indicate developing problems that should be addressed before users experience outages or degraded performance.
Another major advantage of performance counters is their usefulness in capacity planning. Organizations frequently deploy new applications, expand services, and increase workloads over time. Administrators must determine whether existing infrastructure can support these additional demands. Performance metrics provide the information needed to evaluate resource availability and predict future requirements.
Suppose an organization plans to install a new enterprise application on a virtual machine. Before deployment, administrators can monitor CPU utilization, available memory, disk throughput, and network activity on the virtual machine to determine whether sufficient resources are available. If the system is already operating near capacity, administrators may decide to allocate additional resources or deploy the application elsewhere.
This data-driven approach reduces unnecessary hardware spending while improving overall system efficiency. Rather than upgrading systems based on assumptions or complaints, administrators can make decisions supported by measurable evidence.
What Performance Counters Measure
Windows performance counters track many different aspects of system activity. These counters are organized into categories called counter sets. Each counter set contains related measurements for a specific component or service.
Some of the most commonly monitored categories include processor performance, memory usage, storage activity, and networking operations. Each category provides detailed insight into how the system behaves under different workloads.
Processor counters measure CPU activity. They help administrators understand how heavily the processor is being utilized and whether workloads are exceeding available processing power. Common processor-related counters include processor time, interrupt rates, and processor queue lengths.
One of the most widely used processor counters is the percentage of processor time. This counter shows how much of the CPU’s capacity is currently being used. High CPU usage over short periods is often normal, especially during software installations or intensive workloads. However, consistently high CPU usage may indicate inefficient applications, malware infections, or insufficient processing resources.
Processor queue length is another important metric. It measures how many threads are waiting for CPU time. A consistently large queue length may indicate that the processor cannot keep up with system demands.
Memory counters track physical memory usage and virtual memory operations. Memory performance plays a critical role in overall system responsiveness because applications rely heavily on RAM for storing active data and instructions.
Common memory counters include available memory, page faults, and paging activity. Low available memory often forces the operating system to rely on virtual memory stored on disk, which is significantly slower than physical RAM. Excessive paging can lead to severe performance degradation.
Disk counters measure storage subsystem activity. Storage performance affects application loading times, file transfers, and database operations. Even systems with powerful processors can experience poor performance if storage devices become bottlenecks.
Disk-related counters include disk reads per second, disk writes per second, average disk queue length, and average response times. High queue lengths may indicate overloaded drives or insufficient storage performance.
Network counters track communication between systems. In environments that depend heavily on network services, these counters are essential for diagnosing connectivity issues and bandwidth limitations.
Common networking counters include bytes transmitted per second, packets received per second, and network utilization percentages. These metrics help administrators determine whether network congestion or hardware limitations are affecting performance.
In addition to hardware-related counters, Windows also supports application-specific performance counters. Many enterprise applications install their own counters during setup. For example, web servers, database systems, and virtualization platforms often provide specialized counters that expose internal performance metrics.
This flexibility allows administrators to monitor not only the operating system itself but also the applications running on it.
Why Performance Monitoring Is Essential for IT Professionals
Performance monitoring is not just for troubleshooting emergencies. It is a core administrative practice that supports long-term infrastructure stability and efficiency.
One of the primary reasons IT professionals monitor systems is to improve troubleshooting accuracy. Without performance data, diagnosing technical issues becomes much more difficult. Administrators may spend hours testing hardware, reinstalling software, or replacing components unnecessarily.
Performance counters provide measurable evidence that guides troubleshooting efforts. If a system crashes during heavy workloads, administrators can analyze performance logs to identify whether CPU, memory, storage, or networking resources were overwhelmed.
This evidence-based approach reduces downtime and speeds up problem resolution. Instead of guessing, administrators can focus directly on the components responsible for the issue.
Performance monitoring also improves user satisfaction. Slow systems frustrate employees and reduce productivity. By identifying and resolving bottlenecks early, administrators help maintain smoother and more reliable computing environments.
Another major benefit is resource optimization. Many systems are either underutilized or overloaded because administrators lack accurate visibility into resource usage. Monitoring metrics helps organizations allocate resources more effectively.
For example, virtualization platforms often host multiple virtual machines on a single physical server. Without monitoring, some virtual machines may consume excessive resources while others remain mostly idle. Performance counters help administrators balance workloads and maximize hardware efficiency.
Monitoring is equally important in cloud and hybrid environments. Cloud resources often operate on usage-based pricing models. Understanding resource consumption helps organizations avoid unnecessary expenses while ensuring adequate performance.
Security teams also benefit from performance monitoring. Malware, ransomware, and unauthorized processes often create unusual system activity. Sudden spikes in CPU utilization, unexpected network traffic, or abnormal disk activity may indicate malicious behavior.
By continuously monitoring performance counters, security teams can detect suspicious patterns earlier and investigate potential threats more effectively.
The Role of Windows Performance Monitor
Windows includes a graphical utility called Performance Monitor that allows administrators to view and analyze performance counters visually. Performance Monitor has been part of Windows for many years and remains one of the most valuable built-in administrative tools.
The utility provides charts, graphs, logs, and reporting features that help administrators understand system behavior over time. It supports both local and remote monitoring, making it suitable for enterprise environments.
Performance Monitor organizes counters into categories and allows users to add or remove counters dynamically. Administrators can customize views based on the specific metrics they need to analyze.
One of the strengths of Performance Monitor is its ability to display live data in real time. Administrators can watch resource utilization change as workloads increase or decrease. This is especially useful during troubleshooting sessions or performance testing.
Performance Monitor also supports historical logging through Data Collector Sets. These sets allow administrators to capture performance data over extended periods. The collected information can later be analyzed to identify trends and recurring issues.
For example, if users report that a server becomes slow every afternoon, administrators can configure Performance Monitor to collect metrics throughout the day. Reviewing the logs may reveal that backup jobs or scheduled tasks are consuming excessive resources during those periods.
Another advantage of Performance Monitor is its ability to create alerts. Administrators can define thresholds for specific counters and trigger notifications when those thresholds are exceeded. This supports proactive monitoring strategies and helps teams respond to issues before users notice them.
Although Performance Monitor provides powerful graphical capabilities, many administrators eventually transition toward automation tools such as PowerShell because automation scales more effectively in large environments.
Why PowerShell Is Better for Automation
PowerShell has become the standard scripting and automation platform for Windows administration. It provides command-line access to system components, allowing administrators to automate repetitive tasks and integrate monitoring into larger workflows.
Using PowerShell with performance counters offers several advantages over relying solely on graphical tools.
First, PowerShell supports automation. Instead of manually opening Performance Monitor and selecting counters each time, administrators can create scripts that gather metrics automatically.
Second, PowerShell supports remote management. Administrators can collect performance data from remote systems without physically accessing them. This is especially important in enterprise environments where hundreds or thousands of systems must be monitored centrally.
Third, PowerShell integrates easily with other technologies. Performance data collected through scripts can be exported to CSV files, stored in databases, or transmitted to centralized monitoring platforms.
Fourth, PowerShell enables advanced filtering and customization. Administrators can retrieve only the specific metrics they need instead of manually navigating large lists of counters.
Finally, PowerShell helps administrators build proactive monitoring systems. Scripts can run on schedules, generate alerts, restart services, or trigger remediation tasks automatically when certain conditions occur.
For example, a PowerShell script could monitor available memory on a server. If available memory falls below a defined threshold, the script could send an email alert or write an event log entry.
This level of automation reduces administrative overhead and improves operational efficiency.
Understanding the Get-Counter Cmdlet
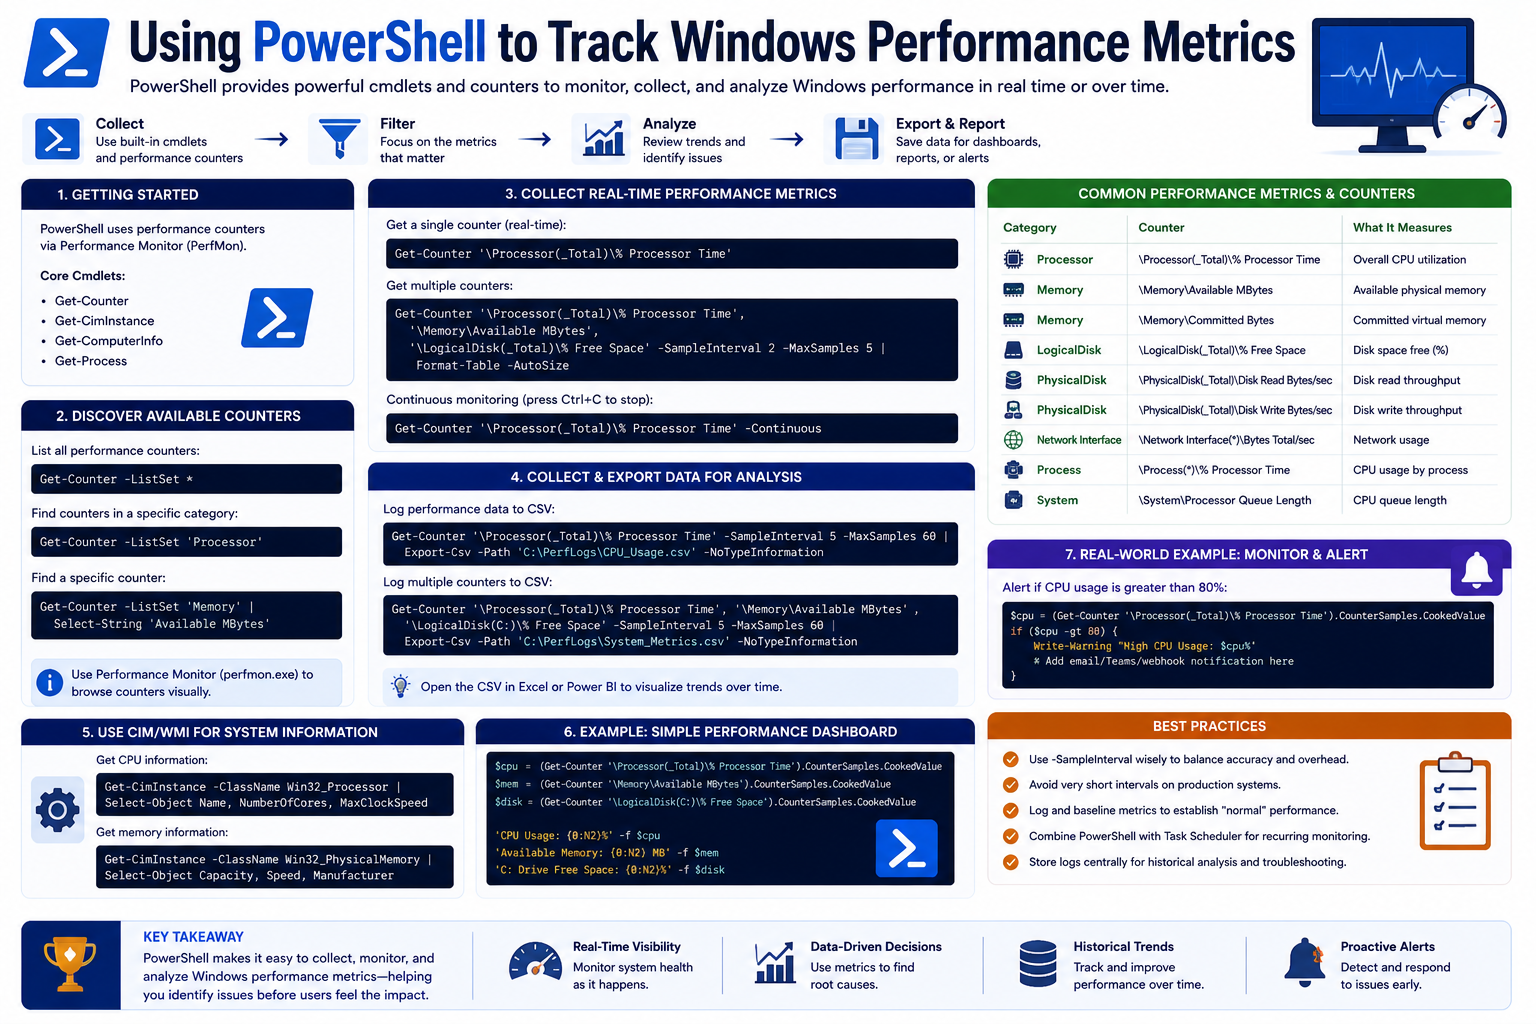
The primary PowerShell cmdlet used for performance monitoring is Get-Counter. This cmdlet retrieves performance counter data directly from Windows.
Get-Counter can collect data from local systems or remote computers. It supports both one-time sampling and continuous monitoring.
When executed without parameters, Get-Counter retrieves a basic set of performance metrics. However, administrators typically specify particular counters to monitor.
Performance counters use a path structure that identifies the counter set, instance, and specific metric. For example:
\Processor(_Total)% Processor Time
This counter path measures total CPU utilization across all processors.
The first section identifies the counter set, the second section specifies the instance, and the final section identifies the individual counter.
Because Windows includes hundreds of counters, administrators often need to search for relevant metrics before collecting data.
The Get-Counter cmdlet includes a parameter called ListSet that helps administrators discover available counters.
Running the following command displays all counter sets available on the system:
Get-Counter -ListSet *
This command returns a large amount of information because modern Windows systems contain extensive monitoring capabilities.
Administrators can narrow the results using filtering techniques. For example, to display counters related to networking, administrators can use filtering with Where-Object.
Filtering reduces clutter and makes it easier to identify relevant metrics.
PowerShell pipelines are especially valuable here because they allow administrators to pass data between commands efficiently.
After identifying the desired counter, administrators can retrieve real-time data using Get-Counter followed by the counter path.
For example:
Get-Counter ‘\Network Adapter(*)\Bytes Total/sec’
This command retrieves network throughput information for installed network adapters.
The output includes timestamps, counter values, and instance names. Administrators can format or export this data as needed.
Building Strong Monitoring Skills
Learning to monitor performance counters with PowerShell is an important skill for modern IT professionals. It combines system administration knowledge with automation capabilities, enabling administrators to manage infrastructure more efficiently.
Strong monitoring skills improve troubleshooting accuracy, support proactive maintenance, enhance security visibility, and contribute to better capacity planning.
As organizations continue adopting virtualization, cloud services, and hybrid infrastructures, automated monitoring becomes even more important. Systems generate massive amounts of operational data, and administrators must be able to collect, analyze, and interpret that information effectively.
PowerShell provides the flexibility needed to handle these challenges. By mastering performance counters and automation techniques, administrators gain deeper insight into system behavior and improve their ability to maintain reliable environments.
In the next section, we will explore how to access Windows Performance Monitor, locate performance counters, and begin collecting performance metrics using PowerShell commands in practical administrative scenarios.
Accessing Windows Performance Monitor and Discovering Performance Counters with PowerShell
Monitoring system performance is one of the most practical skills an IT professional can develop. Every workstation, server, and virtual machine produces a constant stream of operational data that can reveal how efficiently the system is functioning. Windows includes powerful built-in tools for accessing this information, and among the most valuable are Performance Monitor and PowerShell performance counters.
Understanding how to access these tools and retrieve meaningful metrics allows administrators to diagnose issues, optimize systems, and automate monitoring tasks. While many administrators rely on third-party monitoring solutions, Windows already includes a robust performance monitoring framework capable of tracking nearly every aspect of system activity.
Performance monitoring is not limited to enterprise data centers. Even a small office environment benefits from proper monitoring practices. Slow applications, network bottlenecks, high memory consumption, and overloaded processors can affect productivity and create frustration for users. Administrators who know how to analyze performance counters can identify the root causes of these problems quickly and accurately.
The ability to work with performance counters also improves long-term infrastructure planning. Instead of waiting for hardware to fail or systems to become overloaded, administrators can monitor trends over time and make proactive decisions about upgrades and resource allocation.
Before using PowerShell to automate monitoring, it is important to understand how Windows Performance Monitor works and how performance counters are organized. Once these fundamentals are understood, PowerShell becomes much easier to use because administrators already know what metrics they need to collect.
Understanding the Windows Performance Monitoring Framework
Windows includes a built-in architecture designed specifically for performance monitoring. This framework continuously tracks system activity and exposes that information through performance counters.
A performance counter measures a specific type of activity occurring within the operating system or an application. These counters may track processor utilization, memory consumption, disk operations, network traffic, or application behavior.
Counters are grouped into categories known as counter sets. Each counter set contains related metrics. For example, the Processor counter set contains CPU-related metrics, while the Memory counter set contains RAM-related measurements.
Each counter within a counter set has a unique path that identifies the exact metric being measured. A counter path usually contains three parts:
- The counter set name
- The instance name
- The specific counter
An example counter path looks like this:
\Processor(_Total)% Processor Time
In this example:
- Processor is the counter set
- _Total is the instance
- % Processor Time is the counter itself
The instance represents a specific object being measured. Some counter sets have multiple instances. For example, a system with multiple processors may have separate instances for each CPU core.
Understanding this structure is essential because PowerShell uses these counter paths to retrieve performance data.
Opening Windows Performance Monitor
Windows Performance Monitor provides a graphical interface for viewing performance counters. It is useful for administrators who want to visualize system activity before moving into PowerShell automation.
There are several ways to launch Performance Monitor in Windows. The method chosen usually depends on administrator preference and workflow.
One of the easiest methods is using the Start Menu search feature.
Administrators can click the Start button and type the word “Performance” or “perfmon.” Windows automatically searches for matching administrative tools and displays Performance Monitor in the search results.
Once opened, the Performance Monitor console displays several categories on the left side of the interface. These categories include:
- Monitoring Tools
- Data Collector Sets
- Reports
The Monitoring Tools section contains the live Performance Monitor graph. This graph displays real-time counter data and updates continuously.
Initially, the graph usually shows a basic processor utilization counter. Administrators can add additional counters to customize the display.
Another way to launch Performance Monitor is through the Run dialog box.
Pressing Windows + R opens the Run window. Typing the command below launches the utility directly:
perfmon
This method is popular among experienced administrators because it is fast and efficient.
Performance Monitor can also be accessed through the Control Panel administrative tools section. Although modern versions of Windows emphasize search functionality, many administrators still use Control Panel utilities regularly.
To open Performance Monitor through Control Panel:
- Open Control Panel
- Select Administrative Tools
- Choose Performance Monitor
If Administrative Tools is not visible, changing the view mode to Large Icons or Small Icons reveals additional system utilities.
Navigating the Performance Monitor Interface
When administrators first open Performance Monitor, the interface may appear complicated because it contains many categories and configuration options. However, the layout becomes easier to understand with practice.
The main Performance Monitor graph displays counter data visually. Each counter added to the graph appears as a colored line representing changes over time.
Administrators can customize graph settings, adjust refresh intervals, and modify scaling values to improve readability.
The toolbar includes options for:
- Adding counters
- Removing counters
- Pausing data collection
- Saving monitoring sessions
- Viewing reports
The Add Counters window is especially important because it allows administrators to browse available performance counters.
This window displays all installed counter sets. Expanding a counter set reveals the individual counters available for monitoring.
For example, expanding the Processor category may display counters such as:
- % Processor Time
- Interrupts/sec
- Processor Queue Length
Selecting a counter and clicking Add includes it in the monitoring graph.
Administrators can also monitor remote computers by specifying a different system name within the Add Counters dialog box. This feature is extremely useful in enterprise environments where centralized monitoring is necessary.
Understanding Data Collector Sets
One of the most powerful features of Performance Monitor is the ability to create Data Collector Sets.
A Data Collector Set is a collection of counters, logs, and system trace settings used for long-term monitoring. Instead of manually viewing counters in real time, administrators can configure Windows to collect performance data automatically over extended periods.
This is especially valuable for troubleshooting intermittent issues that occur outside normal working hours.
For example, suppose users report that a file server becomes slow every evening. Administrators may not be available to observe the problem directly when it occurs.
A Data Collector Set can record processor, memory, storage, and network metrics continuously throughout the evening. Administrators can later review the logs and identify what caused the slowdown.
Data Collector Sets can also be scheduled to run automatically. This makes them useful for routine performance baselining and trend analysis.
Baselining involves recording normal system behavior under typical workloads. Once administrators understand what normal performance looks like, they can identify unusual activity more easily.
For instance, if a web server normally operates at 30 percent CPU utilization but suddenly begins reaching 90 percent during routine workloads, administrators know something has changed.
Common Performance Counters Administrators Monitor
Different types of systems require different monitoring strategies, but several counters are commonly used across most environments.
Processor counters are among the most frequently monitored metrics.
The following processor counters are particularly useful:
- % Processor Time
- Processor Queue Length
- Interrupts/sec
High CPU usage over long periods may indicate overloaded systems or inefficient applications.
Processor Queue Length measures how many processes are waiting for CPU time. Consistently high values may indicate processor bottlenecks.
Memory counters are equally important because insufficient memory often causes severe performance problems.
Common memory counters include:
- Available MBytes
- Pages/sec
- Page Faults/sec
Low available memory combined with high paging activity usually indicates memory pressure.
Disk counters help administrators identify storage bottlenecks.
Important disk counters include:
- Disk Reads/sec
- Disk Writes/sec
- Average Disk Queue Length
- Average Disk sec/Transfer
Storage delays significantly affect application responsiveness and file access performance.
Network counters help monitor bandwidth utilization and communication efficiency.
Useful network counters include:
- Bytes Total/sec
- Packets/sec
- Output Queue Length
These counters are particularly important for servers handling large amounts of network traffic.
Why PowerShell Is Essential for Performance Monitoring
While Performance Monitor provides excellent visualization capabilities, PowerShell introduces automation and scalability.
Graphical tools are useful for quick diagnostics, but enterprise environments require automated solutions capable of monitoring many systems simultaneously.
PowerShell enables administrators to:
- Gather metrics remotely
- Automate data collection
- Export performance data
- Create alerts
- Schedule monitoring tasks
- Integrate with other tools
Because PowerShell is scriptable, administrators can build customized monitoring solutions tailored to organizational needs.
Instead of manually checking system metrics every day, scripts can collect and analyze data automatically.
This reduces administrative workload while improving consistency.
Introducing the Get-Counter Cmdlet
The primary PowerShell cmdlet used for performance monitoring is Get-Counter.
This cmdlet retrieves performance counter data directly from Windows.
Running Get-Counter without parameters returns a small collection of default system counters.
However, administrators typically specify particular counters to monitor.
For example, retrieving total processor utilization looks like this:
Get-Counter ‘\Processor(_Total)% Processor Time’
This command returns current CPU utilization statistics.
The output includes timestamps, counter paths, and measured values.
One of the advantages of Get-Counter is that it supports both local and remote systems.
Administrators can monitor remote computers using the ComputerName parameter.
This makes PowerShell highly effective for enterprise monitoring.
Discovering Available Counter Sets
Modern Windows systems contain hundreds or even thousands of counters. Administrators therefore need a way to discover which counters are available.
The ListSet parameter helps retrieve this information.
The following command lists all available counter sets:
Get-Counter -ListSet *
Because this command returns extensive information, the output may appear overwhelming initially.
Each counter set includes:
- Counter set name
- Description
- Available counters
- Instance information
Administrators rarely need every available counter, so filtering becomes extremely important.
Filtering Counter Sets with PowerShell
PowerShell pipelines make filtering large amounts of information much easier.
Suppose administrators want only networking-related counters.
The following command filters results containing the word “network”:
Get-Counter -ListSet * | Where-Object { $_.CounterSetName -match ‘network’ }
This command pipes output into Where-Object, which filters the results.
Filtering reduces clutter and helps administrators focus on relevant metrics.
Additional filtering can simplify output even further.
For example:
Get-Counter -ListSet * | Where-Object { $_.CounterSetName -match ‘network’ } | Select-Object CounterSetName
This displays only counter set names instead of full details.
PowerShell’s filtering capabilities are one of its greatest strengths because administrators can manipulate large datasets efficiently.
Retrieving Network Performance Metrics
Once administrators identify the correct counter, they can retrieve live performance data.
Suppose administrators want to monitor network throughput.
The following command retrieves bytes transmitted and received per second:
Get-Counter ‘\Network Adapter(*)\Bytes Total/sec’
This command measures total network traffic across installed network adapters.
The asterisk acts as a wildcard, meaning all adapters are included.
The output includes separate statistics for each network interface.
Network monitoring is especially useful for diagnosing connectivity issues and identifying bandwidth limitations.
For example, unusually high traffic levels may indicate backup jobs, large file transfers, or suspicious activity.
Monitoring Multiple Counters Simultaneously
Administrators often need to monitor several metrics at once.
Get-Counter supports multiple counter paths in a single command.
For example:
Get-Counter ‘\Processor(_Total)% Processor Time’,’\Memory\Available MBytes’
This command retrieves both CPU utilization and available memory.
Monitoring multiple counters together provides better visibility into overall system behavior.
A system experiencing high CPU usage and low memory availability may require different troubleshooting steps than a system with only one resource under pressure.
Continuous Monitoring with Sample Intervals
Get-Counter can collect repeated samples over time instead of retrieving only a single measurement.
The SampleInterval parameter defines how frequently data is collected.
The MaxSamples parameter defines how many samples to capture.
For example:
Get-Counter ‘\Processor(_Total)% Processor Time’ -SampleInterval 5 -MaxSamples 10
This command collects CPU usage data every five seconds for ten samples.
Continuous monitoring is valuable for observing trends and intermittent spikes.
Administrators can analyze whether performance problems occur consistently or only during certain workloads.
Exporting Performance Data
PowerShell also makes exporting performance data simple.
Collected metrics can be stored in files for later analysis.
For example:
Get-Counter ‘\Processor(_Total)% Processor Time’ -SampleInterval 5 -MaxSamples 10 | Export-Csv cpu.csv
This command saves CPU utilization data to a CSV file.
CSV exports are useful because they can be analyzed in spreadsheet software or imported into reporting systems.
Historical logging helps organizations identify long-term trends and recurring issues.
Remote Monitoring with PowerShell
One of PowerShell’s strongest capabilities is remote administration.
Administrators do not need physical access to systems in order to monitor performance.
The ComputerName parameter allows remote metric collection.
For example:
Get-Counter ‘\Processor(_Total)% Processor Time’ -ComputerName Server01
This retrieves CPU statistics from a remote server named Server01.
Remote monitoring is essential in large infrastructures where systems may be distributed across multiple locations.
It also improves response times because administrators can diagnose issues without traveling to physical hardware locations.
Building Practical Monitoring Workflows
As administrators become more comfortable with PowerShell performance monitoring, they often begin building more advanced workflows.
These workflows may include:
- Automated monitoring scripts
- Scheduled data collection
- Alert generation
- Centralized logging
- Dashboard integration
For example, a monitoring script might:
- Check CPU usage every minute
- Record results in a log file
- Send alerts if thresholds are exceeded
- Restart services automatically if necessary
These automation capabilities greatly improve operational efficiency.
Instead of manually monitoring systems, administrators can create self-managing workflows that respond to issues proactively.
The Importance of Performance Baselining
One of the most overlooked aspects of performance monitoring is establishing baselines.
A baseline represents normal system behavior under typical workloads.
Without a baseline, administrators may struggle to determine whether observed metrics are normal or problematic.
For example, a database server running at 70 percent CPU utilization may be completely healthy if that workload is expected.
Conversely, a sudden increase from 20 percent to 70 percent may indicate an emerging issue.
By collecting baseline metrics regularly, administrators gain context for interpreting future performance data.
Baselines are especially valuable after hardware upgrades, software deployments, or infrastructure changes.
Learning to work with Windows performance counters and PowerShell requires practice, but the benefits are substantial.
These skills help administrators:
- Troubleshoot issues more accurately
- Improve system reliability
- Optimize infrastructure performance
- Detect unusual activity
- Reduce downtime
- Automate routine tasks
Modern IT environments generate enormous amounts of operational data. Administrators who can collect, analyze, and automate performance monitoring gain a significant advantage in managing infrastructure effectively.
PowerShell transforms Windows performance monitoring from a manual task into a scalable administrative process. By combining real-time monitoring, historical analysis, automation, and remote management, administrators can maintain better visibility into their environments and respond to issues more efficiently.
In the next section, we will explore advanced PowerShell monitoring techniques, automation strategies, remote monitoring workflows, and methods for building customized performance monitoring solutions for enterprise environments.
Advanced PowerShell Performance Monitoring and Automation Techniques
Performance monitoring becomes far more powerful when administrators move beyond simple real-time checks and begin automating data collection, alerting, and analysis. While graphical tools such as Windows Performance Monitor are excellent for manual diagnostics, modern IT environments require scalable solutions capable of monitoring dozens, hundreds, or even thousands of systems simultaneously. This is where PowerShell becomes an essential administrative tool.
PowerShell provides flexibility, automation, and remote management capabilities that make it ideal for enterprise monitoring tasks. Administrators can gather performance metrics from local and remote systems, store historical data, create threshold-based alerts, and integrate performance information into reporting systems or centralized dashboards.
As organizations continue adopting virtualization, cloud computing, hybrid infrastructures, and automation-driven operations, the ability to monitor performance programmatically becomes increasingly important. Administrators who understand advanced PowerShell monitoring techniques can detect problems faster, optimize infrastructure more effectively, and reduce downtime across the organization.
This section explores advanced strategies for using PowerShell performance counters, including automation, scheduling, data analysis, remote monitoring, and practical administrative workflows.
Why Automation Matters in Performance Monitoring
Manual monitoring works well in small environments or during short troubleshooting sessions, but it quickly becomes impractical in larger infrastructures. Administrators cannot realistically sit in front of monitoring consoles all day watching graphs and counters.
Automation solves this problem by allowing systems to collect and analyze performance data continuously without requiring constant human attention.
Automated monitoring provides several important advantages:
- Continuous visibility into system performance
- Faster detection of issues
- Reduced administrative workload
- Consistent data collection
- Better historical analysis
- Improved response times
- Scalable infrastructure management
For example, a company may operate dozens of servers handling web applications, databases, backups, virtualization workloads, and file storage. Monitoring each server manually would consume enormous amounts of time. Automated scripts can instead collect metrics on a schedule and alert administrators only when problems occur.
Automation also improves consistency. Human administrators may forget to collect certain metrics or may analyze systems differently depending on the situation. Automated workflows follow predefined procedures every time.
This consistency becomes especially valuable for troubleshooting recurring issues because administrators can compare performance data across multiple systems and time periods.
Creating Continuous Monitoring Scripts
One of the simplest ways to automate monitoring with PowerShell is by creating scripts that continuously collect performance counters.
A script can retrieve metrics repeatedly using loops and timed intervals.
For example, administrators may want to monitor processor utilization continuously throughout the day.
A basic workflow might:
- Collect CPU utilization every minute
- Record results in a log file
- Continue running indefinitely
Continuous monitoring scripts help identify patterns that are difficult to detect during short manual observations.
Some performance problems occur only under specific workloads or during certain times of day. Scheduled backups, software updates, antivirus scans, and large user activities can all create temporary performance spikes.
By collecting data continuously, administrators gain a much clearer picture of how systems behave over time.
Another benefit of continuous monitoring is trend analysis. Short-term spikes are not always problematic, but gradual increases in resource usage may indicate developing issues.
For example:
- Gradually increasing memory usage may indicate memory leaks
- Rising disk queue lengths may suggest storage bottlenecks
- Increasing network utilization may signal bandwidth saturation
- Higher CPU usage trends may indicate growing workloads
Continuous monitoring helps administrators identify these trends before they affect users.
Logging Performance Data for Historical Analysis
Historical performance data is one of the most valuable resources available to IT teams.
Real-time monitoring only shows what is happening at the current moment. Historical logs reveal how systems behaved in the past and help administrators understand long-term patterns.
PowerShell makes it easy to export performance data into various formats.
Common export options include:
- CSV files
- Text logs
- XML files
- JSON files
- Databases
CSV files are especially popular because they can be opened in spreadsheet applications for analysis and charting.
Historical logs help administrators answer important questions such as:
- When did performance degradation begin?
- How often do spikes occur?
- Which workloads create the highest resource usage?
- Are systems becoming more heavily utilized over time?
- Do specific applications cause recurring issues?
Suppose users complain that a file server slows down every Monday morning. Historical performance logs may reveal that automated synchronization jobs begin at the same time employees log in for the workday.
Without historical data, identifying such patterns becomes much more difficult.
Historical analysis is also critical for capacity planning. Organizations can compare current resource usage against previous months or years to determine whether infrastructure upgrades are necessary.
Monitoring Remote Systems with PowerShell
Modern infrastructures often span multiple offices, data centers, and cloud environments. Administrators therefore need efficient ways to monitor systems remotely.
PowerShell supports remote performance monitoring through the ComputerName parameter and PowerShell remoting technologies.
Remote monitoring provides several major benefits:
- Centralized management
- Faster troubleshooting
- Reduced travel requirements
- Improved operational efficiency
- Better visibility across distributed environments
Instead of connecting to each server manually, administrators can gather metrics remotely from a central workstation.
For example, a script can retrieve CPU, memory, and disk statistics from multiple servers simultaneously.
This capability is especially valuable during outages or high-load events when administrators need rapid visibility into infrastructure conditions.
Remote monitoring also supports automation at scale. A single script can loop through dozens of systems, collect metrics, and generate reports automatically.
This approach significantly reduces administrative overhead in enterprise environments.
Creating Threshold-Based Alerts
One of the most practical uses of PowerShell monitoring is creating automated alerts.
Alerts notify administrators when performance metrics exceed predefined thresholds.
For example:
- CPU usage exceeds 90 percent
- Available memory falls below a safe level
- Disk space becomes critically low
- Network traffic spikes unexpectedly
Threshold-based monitoring helps administrators respond proactively instead of waiting for user complaints.
PowerShell scripts can trigger several types of alerts, including:
- Email notifications
- Event log entries
- Text messages
- Dashboard warnings
- Ticket creation
- Application restarts
For instance, a monitoring script may check CPU utilization every five minutes. If CPU usage remains above 95 percent for multiple checks, the script could send an alert email to the support team.
This proactive approach reduces downtime and improves service reliability.
Alerts are especially useful for mission-critical systems where even short outages can affect business operations.
Monitoring Server Performance
Servers require especially careful performance monitoring because they often support many users and applications simultaneously.
Different server roles require different monitoring strategies.
File servers typically require close attention to:
- Disk activity
- Network throughput
- Storage queue lengths
Database servers often require monitoring of:
- Processor utilization
- Memory allocation
- Disk latency
- Query-related counters
Web servers may require monitoring of:
- Network traffic
- Request processing times
- Processor usage
- Application pool performance
Virtualization hosts require monitoring of:
- CPU contention
- Memory pressure
- Storage performance
- Virtual machine resource allocation
PowerShell allows administrators to customize monitoring scripts for specific workloads and server roles.
This flexibility is one of the reasons PowerShell remains so valuable in enterprise administration.
Using Performance Counters for Troubleshooting
Performance counters are among the most useful troubleshooting tools available to Windows administrators.
Many technical issues leave clear signatures within system metrics.
For example:
- High CPU usage may indicate runaway processes
- Memory exhaustion may cause excessive paging
- Storage bottlenecks may create long disk queues
- Network congestion may reduce application responsiveness
By analyzing counters carefully, administrators can identify root causes much more quickly.
Suppose users report that a virtual desktop environment becomes slow every afternoon.
Performance counters might reveal:
- CPU utilization spikes during antivirus scans
- Memory availability drops during software updates
- Network throughput increases during backup operations
Each of these observations points administrators toward different solutions.
Without performance data, troubleshooting becomes largely guesswork.
Monitoring Virtual Machines
Virtualization has become a standard component of modern infrastructure. Virtual machines share physical hardware resources, making performance monitoring even more important.
Virtualized environments introduce additional challenges because multiple workloads compete for shared resources.
Performance counters help administrators identify:
- CPU overcommitment
- Memory contention
- Storage bottlenecks
- Network congestion
- Resource allocation imbalances
For example, a virtualization host may appear healthy overall while individual virtual machines experience severe performance problems.
Monitoring counters at both the host and guest levels helps administrators identify where bottlenecks actually occur.
PowerShell automation becomes especially valuable in virtual environments because large infrastructures may contain hundreds of virtual machines.
Scripts can monitor these systems continuously and generate centralized reports.
Integrating Monitoring with Scheduled Tasks
Windows Task Scheduler allows administrators to automate PowerShell monitoring scripts further.
Scripts can run:
- Hourly
- Daily
- Weekly
- At startup
- During specific events
Scheduled monitoring ensures consistent data collection even when administrators are unavailable.
For example, administrators may configure scripts to:
- Collect performance baselines overnight
- Monitor backup windows
- Track peak business-hour workloads
- Record metrics during maintenance operations
Scheduled automation improves visibility into workloads occurring outside normal working hours.
Using Baselines to Identify Abnormal Behavior
Performance baselines represent normal system behavior under expected workloads.
Baselines are essential because performance metrics vary widely between systems.
A web server operating at 70 percent CPU utilization may be functioning normally, while the same utilization on a lightly used workstation could indicate a problem.
Without baselines, administrators cannot accurately determine whether observed metrics are healthy or abnormal.
PowerShell scripts can automate baseline collection by gathering metrics over long periods and storing averages.
Baselines help organizations:
- Detect unusual activity
- Identify performance regressions
- Compare systems consistently
- Measure the impact of upgrades
- Evaluate infrastructure changes
For example, after deploying a new application update, administrators can compare current metrics against previous baselines to determine whether resource usage increased unexpectedly.
Security Benefits of Performance Monitoring
Performance monitoring also supports cybersecurity operations.
Malware and unauthorized processes often create unusual resource usage patterns.
Examples include:
- Sudden CPU spikes
- Unexpected network traffic
- High disk activity
- Abnormal memory consumption
Continuous monitoring helps administrators identify suspicious behavior earlier.
For example, ransomware often generates heavy disk activity while encrypting files. Cryptomining malware frequently creates sustained high CPU usage.
PowerShell monitoring scripts can detect these anomalies and trigger alerts automatically.
Performance monitoring should therefore be considered part of a broader security strategy rather than only a troubleshooting tool.
Exporting and Reporting Data
Collected performance data becomes much more useful when organized into reports.
PowerShell can export metrics into formats suitable for:
- Spreadsheets
- Dashboards
- Reporting platforms
- Databases
- Visualization tools
Reports help administrators communicate findings to management and technical teams.
For example, monthly reports may show:
- Resource utilization trends
- Capacity growth
- Storage consumption
- Network usage patterns
- Server health summaries
These reports support budgeting decisions and infrastructure planning.
Visualization tools can further improve readability by converting raw metrics into charts and graphs.
Combining PowerShell with Enterprise Monitoring Systems
Although PowerShell is powerful on its own, many organizations integrate it with larger monitoring platforms.
PowerShell scripts can feed data into:
- SIEM systems
- Centralized logging platforms
- Cloud monitoring services
- Help desk systems
- Automation frameworks
This integration creates highly scalable monitoring solutions.
For example, performance alerts generated by PowerShell may automatically create support tickets or trigger remediation workflows.
Automation frameworks can even restart services, allocate resources dynamically, or isolate problematic systems automatically.
Challenges Administrators May Encounter
Despite its advantages, performance monitoring also presents challenges.
One common issue is information overload.
Windows exposes hundreds of counters, and inexperienced administrators may struggle to determine which metrics actually matter.
Collecting excessive data can also create unnecessary storage and analysis complexity.
Another challenge involves interpreting metrics correctly.
High CPU usage is not always problematic. Some workloads naturally consume large amounts of processing power.
Likewise, occasional memory spikes or disk activity bursts may be completely normal.
Administrators must therefore analyze counters within the broader context of workload behavior.
Monitoring itself can also consume resources if configured improperly. Extremely aggressive sampling intervals may affect system performance slightly.
Careful planning helps minimize these challenges.
Developing Long-Term Monitoring Strategies
Effective monitoring requires more than simply collecting data.
Organizations should develop structured monitoring strategies that include:
- Defined performance baselines
- Standardized alert thresholds
- Historical logging policies
- Reporting procedures
- Escalation workflows
- Regular review processes
These strategies ensure monitoring efforts remain organized and actionable.
PowerShell supports these long-term strategies by providing flexible automation capabilities.
As administrators gain experience, they often build reusable monitoring frameworks that simplify future deployments.
Conclusion
Windows performance counters provide powerful insight into how systems operate, making them essential tools for troubleshooting, optimization, capacity planning, and security monitoring. While graphical utilities like Performance Monitor are useful for visual analysis and short-term diagnostics, PowerShell transforms performance monitoring into a scalable and automated administrative process.
By using PowerShell cmdlets such as Get-Counter, administrators can retrieve detailed metrics about processors, memory, storage devices, network adapters, and applications. These metrics help identify bottlenecks, diagnose technical issues, and understand workload behavior across both local and remote systems.
PowerShell also enables automation through scripts, scheduled tasks, alerts, logging, and centralized reporting. This allows organizations to monitor infrastructure continuously without relying solely on manual oversight. Automated monitoring improves operational efficiency, reduces downtime, and helps administrators respond proactively to developing issues.
Historical performance data further strengthens infrastructure management by supporting trend analysis, performance baselining, and capacity planning. Instead of reacting only after problems occur, administrators can anticipate resource limitations and optimize environments before users experience disruptions.
As modern infrastructures continue evolving through virtualization, cloud adoption, and hybrid computing models, the ability to automate monitoring becomes increasingly important. Administrators who understand Windows performance counters and PowerShell automation gain stronger visibility into system behavior and greater control over infrastructure performance.
Mastering these skills not only improves day-to-day administration but also supports long-term career growth in system administration, cloud engineering, cybersecurity, DevOps, and enterprise IT operations.