Excel has remained one of the most widely used business tools for decades. Companies use spreadsheets for financial reporting, project tracking, budgeting, inventory management, analytics, and countless other daily tasks. Even as modern cloud platforms and business intelligence systems continue to evolve, Excel still plays a central role because it is familiar, flexible, and easy to customize.
However, traditional spreadsheet workflows often involve repetitive manual work. Many employees spend hours copying information from websites, dashboards, databases, and online platforms into spreadsheets. This process is slow, frustrating, and highly prone to human error. Even a small mistake in a spreadsheet can create reporting problems, inaccurate calculations, or misleading business insights.
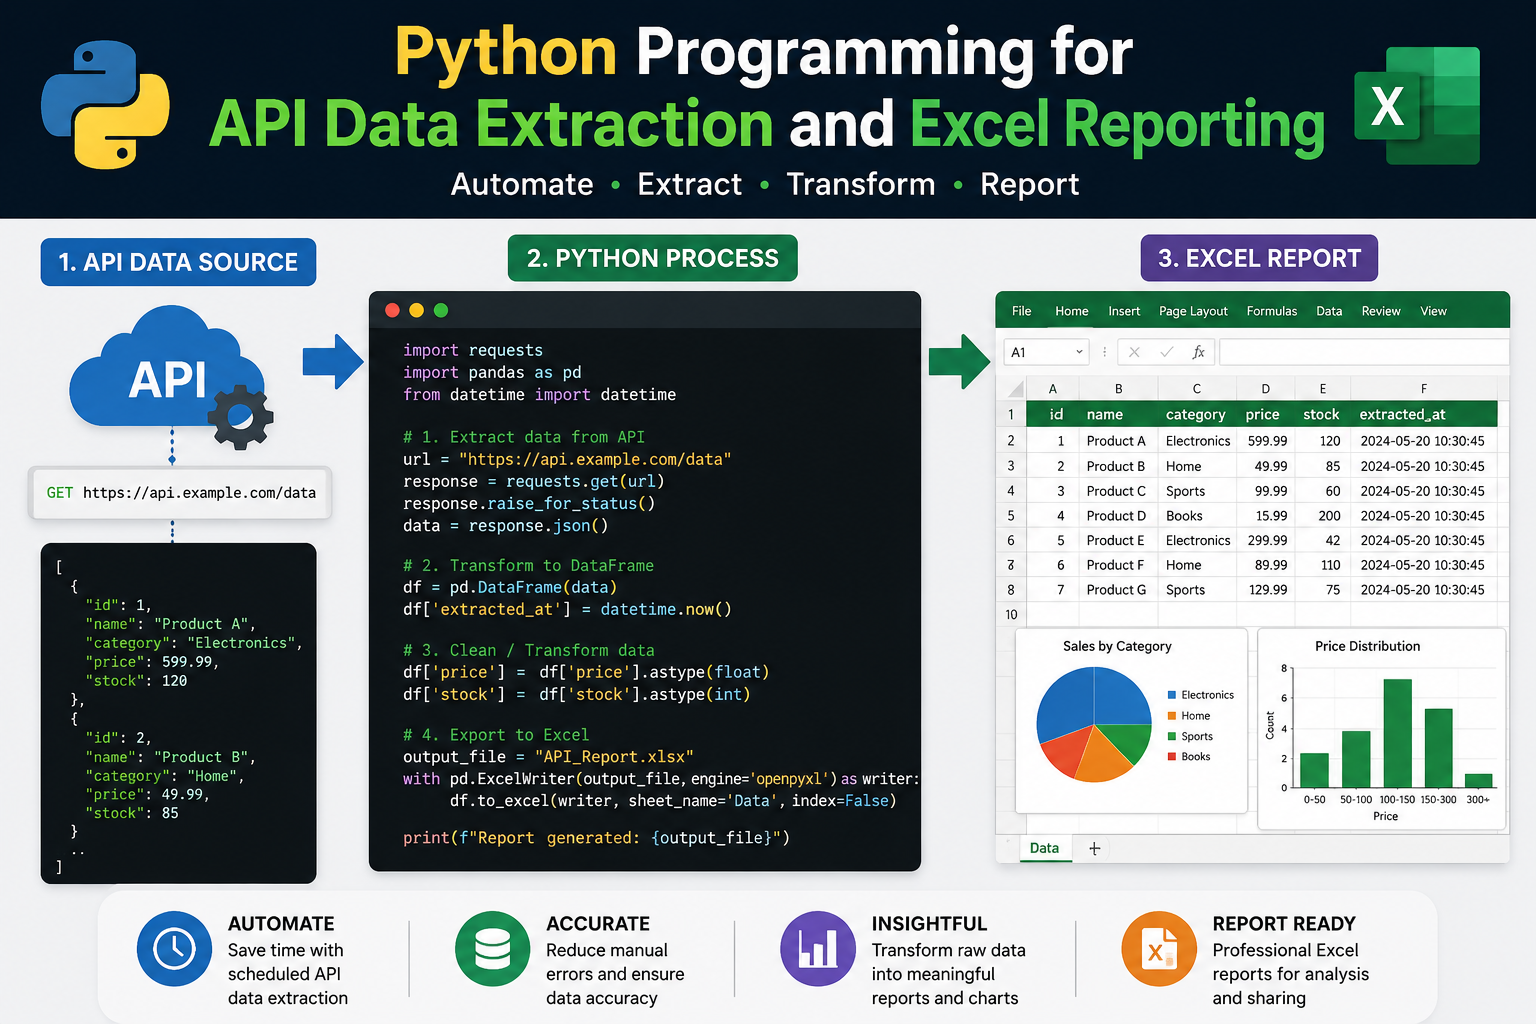
Python offers a far more efficient solution. By combining Python with APIs and Excel, users can automate the entire process of collecting, organizing, and updating spreadsheet data. Instead of manually entering information, Python scripts can connect directly to APIs, retrieve fresh data automatically, process the information, and export everything into Excel files within seconds.
This approach saves time, reduces errors, and creates repeatable workflows that can operate with minimal human involvement. Whether someone works in finance, marketing, IT, logistics, healthcare, or analytics, automating Excel updates with Python can dramatically improve productivity.
This guide explains how Python works with APIs and Excel, how to set up the required tools, and how to begin building scripts that automate data imports.
Why Excel Remains Essential in Business
Despite the rise of advanced analytics platforms and cloud dashboards, Excel continues to dominate many business environments. One reason is accessibility. Almost every office worker already understands the basics of spreadsheets. Employees can create tables, formulas, charts, and reports without needing extensive technical training.
Excel is also extremely flexible. A simple spreadsheet can function as a sales tracking dashboard, a budgeting tool, a reporting system, a customer database, a forecasting model, or a scheduling platform. Because of this versatility, businesses continue relying on Excel even when more advanced systems are available.
The problem appears when organizations begin handling larger amounts of data. Manual spreadsheet management becomes increasingly difficult as businesses grow. Updating spreadsheets by hand may work for small datasets, but it becomes inefficient when information changes constantly.
This is where automation becomes valuable.
The Limitations of Manual Spreadsheet Updates
Many professionals still update spreadsheets manually every day. They may log into websites, download CSV files, copy rows of information, and paste everything into Excel. Although this process seems manageable at first, it creates several long-term problems.
Human Error
Manual data entry introduces mistakes. Employees may accidentally skip rows, paste incorrect values, or overwrite formulas. Even experienced analysts can make errors when handling repetitive tasks.
Time Consumption
Copying and organizing data manually takes time. Reports that should take minutes may require hours of repetitive work.
Inconsistent Formatting
Different team members often format spreadsheets differently. This creates inconsistencies that reduce reporting quality.
Outdated Information
By the time manual reports are completed, the data may already be outdated. Fast-moving industries require real-time or near real-time information.
Scalability Issues
As datasets grow larger, manual workflows become increasingly difficult to maintain.
Python solves these challenges by automating repetitive tasks and connecting directly to online data sources.
Understanding Python’s Role in Automation
Python is one of the world’s most popular programming languages. One reason for its popularity is simplicity. Python code is easier to read than many other programming languages, making it accessible even for beginners.
Python is especially strong in automation and data processing. It can perform repetitive operations much faster than humans while maintaining consistency and accuracy.
When working with Excel, Python can retrieve information from APIs, clean and organize datasets, remove duplicate values, format spreadsheets, create reports automatically, schedule updates, generate charts and summaries, and export data into multiple sheets.
This allows organizations to transform manual workflows into automated reporting systems.
What APIs Actually Are
APIs are the foundation of modern software communication. API stands for Application Programming Interface. An API allows one application to communicate with another application.
In simple terms, APIs act as messengers between systems.
For example, a weather service provides weather information through an API, a financial platform provides stock prices through an API, a social media platform provides analytics through an API, and an e-commerce site provides product information through an API.
Instead of opening websites manually and copying information, Python scripts can request the data automatically.
The API responds with structured information that Python can process immediately.
How APIs Deliver Data
Most APIs deliver information in JSON format. JSON stands for JavaScript Object Notation. Although the name references JavaScript, JSON works extremely well with Python.
JSON organizes data using structures similar to Python dictionaries and lists.
For example, a simple JSON response may look like this:
{
“product”: “Laptop”,
“price”: 1200,
“stock”: 50
}
Python can easily convert this into usable data structures.
Because JSON is structured and predictable, it is ideal for automation.
Why Businesses Use APIs with Excel
Combining APIs with Excel creates powerful reporting systems.
Organizations use these systems for financial reporting, sales dashboards, marketing analytics, inventory tracking, cryptocurrency monitoring, customer analytics, website performance tracking, and IT infrastructure monitoring.
Instead of relying on employees to gather data manually, APIs provide direct access to live information.
Python then processes this information and exports it into spreadsheets automatically.
Benefits of Combining Python, APIs, and Excel
There are several major advantages to using Python with APIs and Excel.
Faster Reporting
Reports that once required hours of work can be generated automatically within minutes.
Improved Accuracy
Automation reduces the chance of manual entry mistakes.
Real-Time Information
Reports can include the latest available data instead of outdated snapshots.
Consistency
Formatting and calculations remain consistent across all reports.
Reduced Workload
Employees spend less time gathering data and more time analyzing it.
Scalability
Automated systems can process large datasets far more efficiently than manual workflows.
These advantages make Python automation extremely valuable in modern business environments.
Installing Python
Before creating automation scripts, Python must first be installed on the computer.
Python can be downloaded from the official Python website. During installation, users should enable the option that adds Python to the system PATH. This allows Python commands to run directly from the command line without manually locating the Python executable every time.
After installation, users can verify Python is working correctly by opening a command prompt or terminal and entering:
python –version
If Python is installed correctly, the system displays the installed version number.
Installing Python properly is the foundation for every automation workflow that follows.
Understanding Python Libraries
Python becomes especially powerful because of its libraries. Libraries are collections of prewritten code that simplify common programming tasks.
Instead of building every function manually, developers can use libraries to save time and reduce complexity.
For API-to-Excel workflows, several libraries are especially important.
Requests
The requests library handles communication with APIs. It sends HTTP requests and receives responses from web services.
Without requests, interacting with APIs would be much more complicated.
Pandas
Pandas is one of the most important data analysis libraries in Python. It provides DataFrames, which organize information into rows and columns similar to Excel spreadsheets.
Pandas makes it easy to sort, clean, filter, and transform data.
Openpyxl
Openpyxl allows Python to create and edit Excel files directly. It supports formatting, fonts, colors, formulas, merged cells, charts, and worksheet management.
Together, these libraries form the core of many Excel automation systems.
Installing Required Libraries
Python libraries can be installed using pip, which is Python’s package management tool.
The required libraries can be installed with this command:
pip install requests pandas openpyxl
Once installed, the libraries become available for use in Python scripts.
Installing libraries only takes a few moments, but they provide enormous functionality that dramatically simplifies development.
Choosing a Development Environment
Although Python scripts can be written in basic text editors, dedicated code editors improve the experience significantly.
Popular choices include Visual Studio Code, PyCharm, Sublime Text, and Jupyter Notebook.
Visual Studio Code is especially popular because it provides syntax highlighting, integrated terminals, debugging tools, extension support, and intelligent code suggestions.
A good development environment makes scripts easier to write, test, and troubleshoot.
Creating Your First Python Script
After installing Python and the required libraries, the next step is creating a basic script.
Most Python automation scripts follow a similar structure:
- Import libraries
- Configure API settings
- Create functions
- Process data
- Export results
A simple script might look like this:
import requests
import pandas as pd
api_url = “https://api.example.com/data”
def get_data():
response = requests.get(api_url)
return response.json()
if __name__ == “__main__”:
data = get_data()
print(data)
Although this example is simple, it demonstrates the core structure used in larger automation systems.
Understanding Import Statements
Import statements load libraries into the script.
For example:
import requests
import pandas as pd
The first line imports the requests library.
The second line imports pandas using the shortcut pd. This shortcut is widely used throughout the Python community.
Without import statements, Python would not recognize the external libraries installed earlier.
Understanding Functions
Functions organize reusable blocks of code.
For example:
def get_data():
response = requests.get(api_url)
return response.json()
This function retrieves data from an API and returns the JSON response.
Functions improve readability and allow developers to reuse logic throughout larger projects.
They also simplify debugging because individual functions can be tested independently.
Understanding the Main Execution Block
This section:
if __name__ == “__main__”:
ensures certain code only runs when the script executes directly.
This is considered a best practice in Python development because it improves organization and modularity.
Inside this block, the script calls the function and processes the results.
What Happens During an API Request
When Python sends a request to an API, several things occur behind the scenes.
First, the script connects to the server hosting the API.
Next, the request asks for specific information.
The server processes the request and sends back a response.
Python then receives the response and converts the information into usable data structures.
This entire process usually takes only seconds.
Understanding this workflow helps developers troubleshoot problems more effectively later.
Fetching Data from APIs with Python
Once Python and the required libraries are installed, the next step is learning how to retrieve information from APIs. This is where automation truly begins. Instead of manually collecting data from websites or exporting reports from online systems, Python scripts can connect directly to APIs and download the information automatically.
APIs provide access to structured data that can be processed and exported into Excel spreadsheets. Almost every modern platform offers APIs, including financial services, cloud providers, marketing platforms, e-commerce systems, weather services, and social media applications.
Understanding how to work with APIs is one of the most valuable skills in modern automation because APIs power so many business systems.
Understanding API Endpoints
An API endpoint is a specific URL that provides access to particular information.
For example, a weather platform might provide one endpoint for current weather and another endpoint for forecasts. A cryptocurrency service may provide one endpoint for coin prices and another for trading volume.
Endpoints allow APIs to organize information into categories.
A typical API structure might look like this:
https://api.example.com/users
https://api.example.com/products
https://api.example.com/orders
Each endpoint returns different data depending on its purpose.
Before writing any Python code, it is important to study the API documentation carefully. Documentation explains:
- Available endpoints
- Required parameters
- Authentication methods
- Request limits
- Response formats
- Error codes
Good documentation saves time and prevents many common mistakes.
Understanding HTTP Requests
APIs rely on HTTP requests for communication. When Python connects to an API, it sends requests asking for information.
The most common request type is a GET request.
A GET request retrieves data from a server.
Example:
response = requests.get(api_url)
This line tells Python to connect to the API endpoint and request information.
The API then sends back a response containing:
- Status codes
- Headers
- Data payloads
- Metadata
- Error information
The requests library handles most of the technical complexity automatically.
Checking Response Status Codes
Every API response includes a status code. These codes indicate whether the request succeeded or failed.
Some common status codes include:
- 200 for success
- 401 for unauthorized access
- 403 for forbidden access
- 404 for missing endpoints
- 500 for server errors
Checking status codes is important because APIs do not always return successful responses.
Example:
response = requests.get(api_url)
if response.status_code == 200:
print(“Request successful”)
else:
print(“Error occurred”)
Without status code checks, scripts may fail silently or process invalid data.
Understanding API Authentication
Many APIs require authentication before allowing access.
Authentication protects services from unauthorized users and excessive traffic.
There are several common authentication methods.
API Keys
API keys are unique identifiers assigned to users or applications.
Example:
headers = {
“X-API-Key”: “your_api_key”
}
The key is included in the request headers.
Bearer Tokens
Bearer tokens provide another authentication method often used in secure systems.
Example:
headers = {
“Authorization”: “Bearer your_token”
}
OAuth Authentication
OAuth is a more advanced authentication framework commonly used by enterprise platforms.
Although OAuth setup is more complicated, it provides stronger security and permission management.
Understanding authentication is essential because many professional APIs require secure access.
Working with API Parameters
APIs often support parameters that customize results.
Parameters can filter, sort, or limit the returned data.
Examples include:
- Date ranges
- Currency selection
- Sorting order
- Search queries
- Geographic filters
- Pagination settings
Parameters are usually passed as dictionaries.
Example:
params = {
“limit”: 10,
“currency”: “usd”
}
Python automatically converts the dictionary into query parameters for the request.
Using parameters correctly helps reduce unnecessary data and improves performance.
Making a Real API Request
One of the best ways to learn API automation is through practical examples.
Consider a cryptocurrency API that provides market data.
Example:
import requests
api_url = “https://api.coingecko.com/api/v3/coins/markets”
params = {
“vs_currency”: “usd”,
“order”: “market_cap_desc”,
“per_page”: 10,
“page”: 1
}
response = requests.get(api_url, params=params)
if response.status_code == 200:
data = response.json()
print(data)
else:
print(“Error”)
This script retrieves cryptocurrency market data in JSON format.
The response includes information such as:
- Coin names
- Prices
- Market capitalization
- Trading volume
- Price changes
The requests library makes API communication straightforward and readable.
Understanding JSON Responses
Most APIs return JSON data because it is lightweight and structured.
JSON resembles Python dictionaries and lists, making it easy to process.
A JSON response may look like this:
{
“name”: “Bitcoin”,
“price”: 65000,
“market_cap”: 1200000000
}
Python converts JSON into dictionaries automatically using:
data = response.json()
Once converted, values can be accessed using keys.
Example:
print(data[“name”])
This structure makes JSON extremely convenient for automation tasks.
Working with Nested JSON
Many APIs return nested JSON structures.
Example:
{
“coin”: {
“name”: “Bitcoin”,
“price”: {
“usd”: 65000
}
}
}
Accessing nested values requires multiple levels.
Example:
print(data[“coin”][“price”][“usd”])
Understanding nested structures is important because many APIs organize data hierarchically.
Looping Through API Data
Many APIs return lists containing multiple records.
Example:
[
{
“name”: “Bitcoin”,
“price”: 65000
},
{
“name”: “Ethereum”,
“price”: 3000
}]Python loops make it easy to process each item.
Example:
for coin in data:
print(coin[“name”])
Loops become especially useful when preparing data for Excel exports.
Extracting Only the Needed Data
APIs often return more information than necessary.
Instead of exporting everything, scripts usually extract only relevant fields.
Example:
crypto_data = []
for coin in data:
crypto_data.append({
“name”: coin[“name”],
“price”: coin[“current_price”],
“market_cap”: coin[“market_cap”]
})
This creates a cleaner dataset that is easier to analyze and export.
Removing unnecessary fields improves readability and reduces spreadsheet clutter.
Why Data Cleaning Matters
Raw API data is rarely perfect.
Common issues include:
- Missing values
- Duplicate records
- Inconsistent formatting
- Incorrect data types
- Unwanted fields
Data cleaning improves report quality and ensures spreadsheets remain usable.
Python provides powerful tools for handling these problems efficiently.
Using Pandas DataFrames
Pandas DataFrames are central to Python data processing.
A DataFrame organizes information into rows and columns similar to Excel.
Creating a DataFrame is simple:
import pandas as pd
df = pd.DataFrame(crypto_data)
Once data enters a DataFrame, it becomes much easier to manipulate.
DataFrames support filtering, sorting, grouping, calculations, and formatting.
Previewing Data
Before exporting information to Excel, it is helpful to inspect the dataset.
Example:
print(df.head())
This displays the first few rows of the DataFrame.
Previewing data helps identify formatting problems early.
Renaming Columns
API field names are not always user-friendly.
Example:
df.columns = [“Name”, “Price”, “Market Cap”]
Readable column names improve report clarity and professionalism.
Sorting Data
Sorting organizes information logically.
Example:
df = df.sort_values(“Price”, ascending=False)
This sorts records from highest price to lowest.
Sorting is especially useful for rankings, leaderboards, and financial reports.
Filtering Rows
Sometimes only certain records are needed.
Example:
df = df[df[“Price”] > 1000]
This keeps only rows where the price exceeds 1000.
Filtering reduces clutter and focuses reports on meaningful information.
Handling Missing Values
APIs sometimes return incomplete data.
Missing values may appear as null entries.
Pandas provides tools to manage these issues.
Example:
df = df.fillna(0)
This replaces missing values with zero.
Another option removes incomplete rows entirely.
Example:
df = df.dropna()
Handling missing values properly prevents spreadsheet issues later.
Converting Data Types
API data may not always arrive in the correct format.
For example, numeric values may appear as text.
Pandas allows type conversion.
Example:
df[“Price”] = df[“Price”].astype(float)
Correct data types improve calculations and formatting inside Excel.
Formatting Dates
Date formatting is another common task.
APIs often return timestamps that are difficult to read.
Example:
df[“Date”] = pd.to_datetime(df[“Date”])
Dates can then be formatted more clearly.
Readable dates improve report usability.
Adding Calculated Columns
Pandas can create entirely new columns using calculations.
Example:
df[“Price in Euros”] = df[“Price”] * 0.93
Calculated columns add extra insights before exporting data into Excel.
This reduces the need for manual spreadsheet formulas later.
Removing Duplicate Records
Some APIs may return duplicate entries.
Duplicates can distort reports and calculations.
Pandas removes duplicates easily.
Example:
df = df.drop_duplicates()
Maintaining clean datasets improves reporting accuracy.
Combining Multiple APIs
Many real-world workflows involve multiple APIs.
For example:
- Sales data from one API
- Marketing analytics from another
- Financial data from a third
Python can combine all these sources into unified reports.
Example:
sales_df = pd.DataFrame(sales_data)
marketing_df = pd.DataFrame(marketing_data)
combined_df = pd.merge(sales_df, marketing_df, on=”date”)
This creates a single DataFrame containing information from multiple systems.
Combining datasets creates richer business insights.
Understanding Pagination
Large APIs often split data into pages.
This prevents servers from sending massive datasets all at once.
Pagination requires scripts to request multiple pages sequentially.
Example:
page = 1
while True:
params[“page”] = page
response = requests.get(api_url, params=params)
data = response.json()
if not data:
break
page += 1
Pagination is essential when working with large datasets.
Handling API Rate Limits
Many APIs restrict how frequently requests can be made.
Exceeding rate limits may temporarily block access.
Python scripts often include delays between requests.
Example:
import time
time.sleep(1)
This pauses execution for one second.
Respecting rate limits helps maintain reliable API access.
Adding Error Handling
Production scripts should include error handling to prevent crashes.
Example:
try:
response = requests.get(api_url)
response.raise_for_status()
data = response.json()
except requests.exceptions.RequestException as e:
print(“Error:”, e)
Error handling improves script stability and reliability.
Without proper error handling, automation systems may fail unexpectedly.
Testing API Scripts
Testing is important before exporting data into Excel.
Developers should verify:
- Responses contain expected data
- Columns appear correctly
- Data types are accurate
- Missing values are handled properly
- Calculations work correctly
Careful testing prevents reporting problems later.
Preparing for Excel Export
Once the data is cleaned and organized, it is ready for Excel.
At this stage, the DataFrame should contain:
- Proper column names
- Correct formatting
- Clean records
- Relevant fields
- Calculated values if needed
The next step involves exporting this processed data into Excel files with professional formatting and automation features.
Using Python to Import API Data into Excel
Once API data has been collected, cleaned, filtered, and organized, the final step is exporting everything into Excel. This is where Python becomes especially valuable because it can generate spreadsheets automatically without requiring manual formatting or copy-and-paste work.
Excel remains the preferred reporting format in many organizations because employees already know how to work with spreadsheets. Decision-makers can open reports immediately, review charts, apply filters, and share files across departments.
Python allows developers and analysts to automate the entire reporting process from beginning to end.
Instead of spending hours preparing spreadsheets manually, scripts can create professional Excel reports in seconds.
Why Automated Excel Reporting Matters
Automated Excel reporting provides several major advantages.
Consistency
Reports generated by Python follow the same structure every time. Formatting, calculations, and layouts remain standardized across all outputs.
Speed
Large datasets that once required hours of preparation can be exported almost instantly.
Accuracy
Automation reduces the risk of manual formatting mistakes, incorrect formulas, or missing records.
Scalability
Python can handle datasets much larger than what most users can comfortably process manually.
Scheduled Updates
Reports can refresh automatically on a schedule without requiring employee involvement.
These benefits make automated Excel generation highly valuable in modern organizations.
Exporting Data with Pandas
Pandas provides one of the simplest ways to export data into Excel.
After creating a DataFrame, exporting requires only a single line of code.
Example:
df.to_excel(“crypto_data.xlsx”, index=False)
This command creates an Excel file named crypto_data.xlsx.
The parameter index=False prevents pandas from adding row numbers as an extra column.
Without this parameter, Excel would contain unnecessary index values.
Understanding ExcelWriter
For more advanced exports, pandas provides ExcelWriter.
ExcelWriter allows multiple worksheets and greater customization.
Example:
with pd.ExcelWriter(“report.xlsx”) as writer:
df.to_excel(writer, sheet_name=”Market Data”, index=False)
This creates a worksheet named Market Data inside the Excel file.
Using ExcelWriter is especially useful when building larger reports containing multiple sheets.
Creating Multi-Sheet Reports
Business reports often contain several categories of information.
For example:
- Sales summaries
- Marketing statistics
- Financial performance
- Inventory levels
- Customer analytics
Python can place each dataset into its own worksheet.
Example:
with pd.ExcelWriter(“business_report.xlsx”) as writer:
sales_df.to_excel(writer, sheet_name=”Sales”, index=False)
marketing_df.to_excel(writer, sheet_name=”Marketing”, index=False)
finance_df.to_excel(writer, sheet_name=”Finance”, index=False)
This creates a structured workbook containing multiple sheets.
Multi-sheet reports improve organization and readability.
Understanding Openpyxl
Although pandas handles basic exports well, openpyxl provides more advanced Excel formatting capabilities.
Openpyxl allows developers to:
- Change fonts
- Apply colors
- Merge cells
- Create formulas
- Insert charts
- Resize columns
- Style headers
- Freeze panes
- Protect worksheets
This transforms simple spreadsheets into polished business reports.
Opening Existing Workbooks
Openpyxl can load Excel files after pandas exports them.
Example:
from openpyxl import load_workbook
wb = load_workbook(“report.xlsx”)
ws = wb.active
This opens the workbook and selects the active worksheet.
Once loaded, the worksheet becomes fully editable through Python.
Adding Report Titles
Professional reports usually include titles.
Example:
ws.insert_rows(1)
ws[“A1”] = “Cryptocurrency Market Report”
This inserts a new row at the top and adds a title.
Titles improve readability and make reports look more polished.
Formatting Fonts
Openpyxl allows custom font styling.
Example:
from openpyxl.styles import Font
ws[“A1”].font = Font(bold=True, size=16)
This makes the title bold and increases the font size.
Font styling improves report presentation significantly.
Merging Cells
Titles often span multiple columns.
Example:
ws.merge_cells(“A1:E1”)
This merges cells across columns A through E.
Merged titles create cleaner-looking reports.
Center Aligning Text
Alignment improves readability.
Example:
from openpyxl.styles import Alignment
ws[“A1″].alignment = Alignment(horizontal=”center”)
This centers the report title horizontally.
Formatting Header Rows
Headers should stand out visually from the rest of the spreadsheet.
Example:
from openpyxl.styles import PatternFill
header_fill = PatternFill(
start_color=”D3D3D3″,
end_color=”D3D3D3″,
fill_type=”solid”
)
This creates a gray background style.
Headers can then receive the formatting.
Example:
for cell in ws[2]:
cell.font = Font(bold=True)
cell.fill = header_fill
This makes header text bold and adds background color.
Professional formatting improves usability and presentation quality.
Adjusting Column Widths
Default Excel column widths are often too narrow.
Python can automatically resize columns based on content length.
Example:
for column in ws.columns:
max_length = 0
column_letter = column[0].column_letter
for cell in column:
if cell.value:
max_length = max(max_length, len(str(cell.value)))
ws.column_dimensions[column_letter].width = max_length + 2
This improves readability significantly.
Users no longer need to manually resize columns after opening the report.
Formatting Numbers
Reports often contain currency values, percentages, or dates.
Openpyxl supports number formatting.
Example:
for cell in ws[“B”]:
cell.number_format = “$#,##0.00”
This formats column B as currency.
Number formatting makes reports easier to interpret.
Applying Conditional Formatting
Conditional formatting highlights important values automatically.
Example uses include:
- Highlighting low inventory
- Flagging negative profits
- Showing high-performing sales regions
Example:
from openpyxl.formatting.rule import CellIsRule
ws.conditional_formatting.add(
“B2:B100”,
CellIsRule(operator=”greaterThan”, formula=[‘1000’])
conditional formatting improves visual analysis.
Freezing Header Rows
Large spreadsheets benefit from frozen headers.
Example:
ws.freeze_panes = “A2”
This keeps the first row visible while scrolling.
Frozen panes improve navigation inside large reports.
Adding Excel Formulas
Openpyxl can insert formulas directly into worksheets.
Example:
ws[“F2”] = “=SUM(B2:E2)”
This adds a formula calculating totals across columns.
Formulas allow Excel users to continue working dynamically with exported reports.
Creating Charts
Charts help visualize trends and patterns.
Openpyxl supports chart creation directly within Python.
Example:
from openpyxl.chart import BarChart, Reference
chart = BarChart()
data = Reference(ws, min_col=2, min_row=1, max_row=10)
chart.add_data(data, titles_from_data=True)
ws.add_chart(chart, “H2”)
Charts improve report presentation and make insights easier to understand.
Saving the Workbook
After formatting is complete, the workbook must be saved.
Example:
wb.save(“formatted_report.xlsx”)
This finalizes all changes and creates the completed Excel file.
Automating Report Generation
The real power of Python appears when reports generate automatically.
Instead of running scripts manually, organizations can schedule them.
Automated reports ensure consistent delivery without requiring employee involvement.
Using Task Scheduler on Windows
Windows includes Task Scheduler for automation.
The process involves:
- Creating the Python script
- Creating a batch file
- Scheduling execution
Example batch file:
python C:\scripts\api_to_excel.py
Task Scheduler can run the script daily, weekly, hourly, or at custom intervals.
Using Cron Jobs on Linux and Mac
Linux and macOS use cron jobs for scheduling.
Example:
0 9 * * * python /path/to/script.py
This runs the script every day at 9 AM.
Cron jobs are lightweight and highly reliable.
Building Complete Reporting Pipelines
Advanced organizations often build complete reporting pipelines.
A reporting pipeline may:
- Pull data from multiple APIs
- Process and clean information
- Merge datasets
- Generate Excel reports
- Apply formatting
- Email completed reports
- Archive previous versions
Example structure:
def main():
stock_data = get_stock_data()
weather_data = get_weather_data()
sales_data = get_sales_data()
combined_data = process_data
stock_data,
weather_data,
sales_data
( export_report(combined_data)
if __name__ == “__main__”:
main()
Pipelines reduce manual effort dramatically.
Sending Reports by Email
Python can distribute reports automatically.
Libraries like smtplib allow scripts to send emails with attachments.
Example workflows include:
- Daily sales reports
- Weekly financial summaries
- Monthly analytics dashboards
Automatic email delivery ensures stakeholders receive reports consistently.
Logging Script Activity
Production automation systems should log activity.
Logs help track:
- Successful executions
- Failed requests
- Missing data
- Export issues
Example:
import logging
logging.basicConfig(filename=”report.log”)
logging.info(“Report generated successfully”)
Logging improves troubleshooting and maintenance.
Handling Large Datasets
Large datasets require optimization.
Strategies include:
- Pagination
- Incremental updates
- Database storage
- Efficient filtering
- Chunk processing
Optimized scripts perform better and reduce memory usage.
Improving Script Security
Security becomes important when working with APIs and sensitive business information.
Best practices include:
- Storing API keys securely
- Using environment variables
- Encrypting credentials
- Restricting access permissions
- Avoiding hardcoded passwords
Security protects business systems and prevents unauthorized access.
Using Environment Variables
Environment variables store sensitive information outside scripts.
Example:
import os
api_key = os.getenv(“API_KEY”)
This prevents credentials from appearing directly in source code.
Version Control with Git
As scripts grow larger, version control becomes valuable.
Git allows developers to:
- Track changes
- Restore previous versions
- Collaborate with teams
- Manage deployments
Version control improves long-term maintainability.
Testing Automation Systems
Before deploying automation systems, thorough testing is critical.
Testing should verify:
- API connectivity
- Data accuracy
- Formatting correctness
- File generation
- Error handling
- Scheduling reliability
Testing prevents production failures.
Common Challenges in Excel Automation
Several common challenges appear in real-world projects.
API Downtime
External services may become temporarily unavailable.
Rate Limits
Too many requests can trigger temporary blocks.
Changing Data Structures
API providers sometimes modify response formats.
Excel Compatibility Issues
Large files may cause performance problems.
Data Quality Problems
APIs may return incomplete or inconsistent information.
Proper planning and error handling help manage these challenges.
Why Python Is Ideal for Excel Automation
Python has become a preferred automation language because it combines simplicity with powerful functionality.
Advantages include:
- Easy syntax
- Strong community support
- Extensive libraries
- Excellent data processing tools
- Cross-platform compatibility
- Scalability
These strengths make Python suitable for both beginners and experienced developers.
The Future of Automated Reporting
Automation continues growing across industries.
Businesses increasingly rely on:
- Real-time analytics
- Automated dashboards
- AI-driven insights
- Cloud-based reporting
- Integrated data pipelines
Python plays a central role in these systems because it integrates easily with APIs, databases, cloud platforms, and analytics tools.
As organizations handle larger amounts of information, automated reporting becomes even more important.
Practical Business Use Cases
Python API automation supports many business scenarios.
Examples include:
- Financial market tracking
- Inventory management
- Customer analytics
- Marketing campaign monitoring
- IT infrastructure reporting
- Cryptocurrency analysis
- Sales forecasting
- Operational dashboards
These workflows improve efficiency while reducing repetitive labor.
Conclusion
Python provides a powerful bridge between APIs and Excel, allowing businesses to automate data collection, processing, and reporting with remarkable efficiency. Instead of manually copying information into spreadsheets, organizations can build automated workflows that retrieve live data directly from APIs and export it into professionally formatted Excel reports.
By combining libraries such as requests, pandas, and openpyxl, Python can handle every stage of the process. Scripts can connect to APIs, clean and transform datasets, generate calculations, format worksheets, create charts, and distribute reports automatically. This reduces human error, improves consistency, and saves enormous amounts of time.
The ability to automate Excel reporting is valuable across many industries, including finance, marketing, logistics, healthcare, analytics, and IT operations. As businesses continue relying on real-time information and large datasets, automation becomes increasingly important for maintaining speed and accuracy.
One of the biggest advantages of Python is accessibility. Users do not need to become professional software developers to benefit from automation. Even basic Python knowledge can eliminate hours of repetitive spreadsheet work and dramatically improve productivity.
Starting with a small automation project is often the best approach. A simple script that imports API data into Excel can quickly evolve into a complete reporting pipeline capable of handling complex workflows automatically. Over time, these systems become essential tools for modern business operations.
Python, APIs, and Excel together create an efficient and scalable reporting solution that transforms how organizations manage data.